Pages

Sunday, May 15

Only Fools and Horses...

When Our Man was growing up in the leafy yet mean suburbs of London during the late 80’s and early 90’s, the most popular idiom floating around was “only fools and horses”.  The idiom was a shortened form of an old saying ("only fools and horses work") and represented the philosophy of life that those people who do not look for an easy way of earning a living are fools.  The idiom was enshrined within popular culture through the eponymous TV, which was (of course) one of Our Man’s favourites! 

Only Fools and Horses” followed the capers of Derek “Del Boy” Trotter, a fast-talking cockney trader who lived in a council flat in a high-rise tower block (‘Nelson Mandela House’, no less) in Peckham (South London), and his (nice but slightly clueless younger brother) Rodney as they try to get rich…quickly.  It goes without saying that their futile schemes, mainly involving trading in various low-quality and/or black market goods (think Russian camcorders, luminous yellow paint, and the like), regularly backfire but this doesn’t dim their hopes with Del Boy often proclaiming that by “this time next year we’ll be millionaires”.  Only Fools and Horses succeeded by capturing the ethos of Thatcherite Britain where the ideals of capitalism and deregulation meant that there was hope that anyone with the right product, skills or luck could be a millionaire by this time next year. 

Fittingly, Only Fools and Horses saw its viewership peak (c24mn people in the UK, a viewership that in US-terms would be similar to that seen for final episode of M*A*S*H) for a Christmas Special in 1996, as Thatcherism was on the brink of being rejected at the ballot box.  So why’s Our Man talking about a long-since defunct TV sitcom?  Well, other than to introduce you, my long-suffering readers, to some fine British Comedy (I mean, how can you not love this), Only Fools and Horses has been strangely newsworthy in recent weeks.  Firstly, with the sad passing of John Sullivan (the creator and writer) and then with the news that the Royal Wedding, after 15years, has finally knocked that Christmas-96 episode out of the Top 10 largest UK audiences ever.

However, thinking about Only Fools and Horses also led Our Man to cast his mind back to the other idiom of Thatcherite Britain; “as safe as houses”.   While the phrase had been around a long-time (representing the strength of UK housing as an investment since at least the 1950’s, if not well before), it gained broad appeal during the 1980's spurred by the Thatcherism-defining Housing Act of 1980.  The Act brought the opportunity of home-ownership to millions as it gave council house tenants (such as those living in ‘Nelson Mandela House’) the right to buy their dwelling, and is credited with helping drive the home ownership rate in the UK from 55% in 1980 to 64% just 7 years later. 

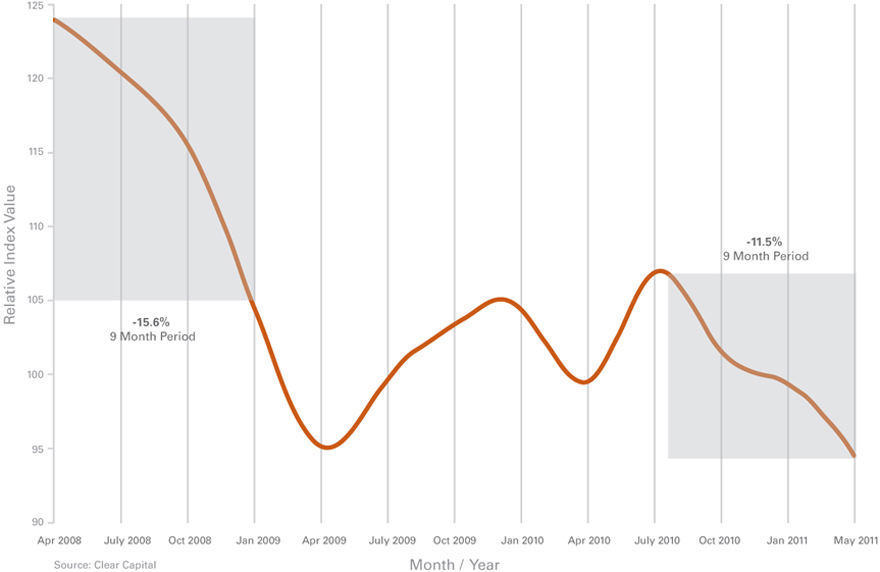
Unfortunately, in the last few years, we’ve seen that “as safe as houses” has proved to be an inadequate motif for the risks of home-ownership both in the UK and the US.  Furthermore in recent weeks, after ill-conceived government efforts to prop up real estate have largely faded, prices have largely started to fall through their 2009 lows; let’s hope it is just a temporary phenomenon and that the impact on the economy (and by extension) is more “contained” this time.


Tuesday, May 3

Silver has a Cloudy Future

It seems like just a few days ago that Our Man was pointing in the direction of Silver’s chart and suggesting a bubble might be brewing (see here).  As if to confirm that it was a parabolic move, Silver moved from c$37 back in late March to brush with the $50-level last week, a move of 35%+ in around 5-weeks!    To put these moves into some context here are some charts on Silver and the various instruments one can play it through.  Firstly, the same long-term weekly close graph that Our Man showed last time – note the nominal all-time high back in 1979** when the Hunt Brothers tried to corner the market. 


Now, here’s a Bloomberg screen showing what Silver has done over the last 12months.  Notice how it started to rise following the rumours of QE2 in August, and how also rampant the move has been.


Finally, here’s a chart showing the premium to NAV of the Sprott Physical Silver Trust (PSLV) for the month of April. 

This trust holds all of its assets in physical silver, thus the chart shows how much people were willing to pay ABOVE the price of silver for a guarantee (or as close to one as possible) that it was held in physical form.  As you can see, even though silver had moved 179%+ since August…investors were willing to pay 15-25% above the spot price (or the ETF) in order to buy into Sprott Physical Silver Trust.  Think about that for a moment – not only are people willing to buy silver after it has risen 150%+ in well under a year, but they’re also prepared to pay an addition 15-25% premium on top of its price to do so.  Not only does it suggest they’re keen to buy silver, it also suggests that they don’t believe that SLV (the Silver ETF run by Blackrock), or other similar instruments, that claims to hold their Silver in physical form (since SLV, as an ETF, trades almost exactly at its NAV).  To be proven right, these investors either need a continued rally in silver or SLV (or other instruments) to be fraudulent (or at least people to fear that they may be) in their claims of holding physical silver.  

This kind of sentiment, coupled with the final surge towards $50 over the Easter weekend, proved too tempting for Our Man; while he definitely missed the perfect entry point, a small put position (25bps of risk initially) on the SLV ETF was added to the portfolio on Easter Monday.   Since then, Silver (and SLV) has been all over the place – falling then bouncing following Bernanke’s press conference, before falling heavily over the last few days.  

Interestingly, the fall is being attributed to Comex increasing its margin requirements for Silver with some (various silver bugs) claiming such a move is a conspiracy to crush the metal price!   Frankly, Our Man finds that idea somewhat amusing and another possible sign of the bubblemania that surrounds silver.  Thankfully, the excellent Kid Dynamite explained the situation far more eruditely than Our Man’s clumsy drafts.  Simply put (i) the CME acts as the central clearing-house and so takes the risk of investors not meeting margin calls and (ii) it sets it margin requirements in dollar (not % of contract value) terms.  What this means is that as a futures contract value increases (i.e. as Silver goes up by 150%+ in 8 months) the exchange should require greater $ margin in order to cover the same percentage of an in investor’s potential losses.  This is further exacerbated when the volatility of the price increases, as this means bigger swings in price, and thus a sensible exchange should increase its margin in order to cover these larger swings (and reduce its risk of an investor not meeting margin calls).  Apparently, however, this is lost on some…and it’s just an evil conspiracy.

(** Keep this in mind, when you read the next Chartology)

Sunday, May 1

April Review

Portfolio Update
As indicated last month, following the addition of some capital, there was a little movement within the portfolio but the books were not uniformly adjusted.  In fact, the majority of the cash went unspent, and thus portfolio’s exposures declined slightly during the month.  The various books that saw changes were:
- Option/Hedge book:  This was increased slightly and saw its exposure broadened during the month with Jan-12 60 strike puts on the Russell 2000 ETF (IWM) added.  Additionally, following Silver’s brief mention in March and its continued rapid ascent to touch $50 in late April, a small position was taken in some Jan-12 30-strike puts on the Silver ETF (SLV).
- The Long Treasury book was increased.  Rather than buy direct exposure (through either TLT, the existing bond, or other ETFs that offered direct Long Treasury exposure), the exposure has been gained indirectly through a Jan-13 25-strike put option on TBT.  TBT is an instrument that seeks “daily investment results that correspond to twice (200%) the inverse (opposite) of the daily performance of a 20+ Year U.S. Treasury Bond Index”.  These indices are generally not terribly attractive (and to be avoided), but Our Man is hoping to benefit from the large negative carry (-9.5%+ per annum) and (hopefully) a trend towards lower yields in long-end Treasury bonds.
- The Energy Efficiency book and the Bond Funds were increased to levels broadly similar to those held throughout the first-quarter through adding to existing positions.  The Currencies book was increased slightly (as discussed in last month’s wrap-up)
- The NCAV/Absolute value book was updated (the moves and rationale can be seen in this post).  However, the existing positions were not resized to reflect new capital due to the prohibitive cost (given each position’s small size, it required a >15% return per position just to cover the brokerage commission)

Performance Review
April proved to be a quiet but steadily positive month for the portfolio, which eked out gains of +0.86% (YTD: -0.37%) over the course of the month.  While the number of positive and negative days was evenly split, the positive days consistently had a larger impact on the portfolio. 

Despite all the fears surrounding the debt ceiling, the US fiscal deficit, and the stance of the Federal Reserve, the Long-end Treasury Book (+68bps) was a large driver of performance.  It was ably supported by the Bond Funds (25bps) book which contributed steadily throughout the month. 

Unfortunately, the Currencies book (-29bps) was a major negative contributor.  The reasons were two-fold; firstly while the US Treasury Secretary and the Chairman of the Federal Reserve offered some support to the US Dollar, the market believes their support is nothing more than token and they would be comfortable with a weaker dollar.  Secondly, and more importantly, the hike in the ECB’s interest rates was well telegraphed (and discussed last month) investors believe that this is the start of an interest raising cycle by the ECB with a further 50bps expected by year-end.  It is on this second point that Our Man differs in his views from the market…

 The equity-side mixed performance amongst the various books.  The Value Equity book (+69bps) was the main positive contributor driven by the continued positive news and strong price action in THRX.  These gains were supplemented by a small positive contribution from the Other Equities book (+8bps).  The weak performance of some micro-cap names hindered the NCAV book (-23bps), which unlike the broader market has seen no real bounce since the days following the Japanese earthquake.  The Energy Efficiency book (-16bps) was a negative contributor; though the position in AXPW is small in size it is, and will likely continue to be, exceptionally volatile which befits its status as a development-orientated company.  The Put/Hedges book (-23bps) and the China-thesis (-3bps) both suffered as the market rose during the month.


Portfolio (as at 4/30 - all delta and leverage adjusted, as appropriate)
34.0% - Long Treasury Bonds (Aug-29 Bond & TLT, and 50bps premium in TBT Jan-13 puts)
21.6% - Bond Funds (VBIIX, DLTNX and HSTRX)
7.0% - Value Idea Equities (THRX, and DRWI)
3.8% - NCAV Equities
2.7% - Other Equities (NWS, CMTL and SOAP)
0.5% - Energy Efficiency (AXPW)

-0.1% - China-Related Thesis (10bps premium in FCX put)
-1.2% - Hedges/Put Options (18bps premium in S&P Dec-11 puts, 20bps in IWM Jan-12 puts, and 17bps SLV Jan-12 puts)

-6.6% (leverage-adjusted) – Currencies (EUO – Short Euro)

27.3% - Cash