Pages

Saturday, April 30

2022: First Quarter Update

 Portfolio Update
- Carbon Credits:  OM has debated taking a position in carbon credits for a while but finally took the plunge at the start of the year with an initial position in KraneShares Global Carbon Strategy (KRBN).   It has become clear with the Paris Accord & COP26 that the Western world (at least) is focused on carbon and has both set a target and timeline for its reduction.  To achieve these would require aggressive moves; California and the EU are the leading proponents of and first movers in decarbonization and have large cap-and-trade carbon allowance programs.   Unsurprisingly, the goal of these programs is to reduce carbon and hence both have created incentives for these carbon credits to increase in price over time.   KRBN has ~90% of its capital invested in EU and California Carbon Allowance Futures.

- Commodities/Mining: The case for many commodities/mining can broadly be understood by reading any of OM’s pieces on Uranium or Tin.   While OM believes these two commodities are the clearest examples of limited/constrained supply and increasing demand, many other commodities show a similar supply issues due to years of underinvestment and increasing demand.   Ironically, the demand side is often impacted by the increased desire for ‘renewables’ or ‘electric vehicles’, which are vastly more commodity intensive than the fossil fuel alternative.  OM began the theme with a position in Filo Mining (FLMMF), though the overall size of Commodities/Mining is likely to be limited while Uranium and Tin remain such significant positions.

- Energy: OM exited his position in Sandridge Energy (SD) during the first quarter.  The company continues to perform, and almost tripled for OM. Energy displays many of the same traits as Commodities/Mining, and OM preferred to allocate his capital there.

- Short/Hedges:  OM implemented a hedge for the first time in a long while; it seemed clear that inflation would lead to higher rates in the short-term with with various factors (including demographics) also suggesting the 40-year bull market in bonds could be over.  OM has largely avoided expressing such views in the past due to the limited ways in which to execute them efficiently.  This changed last year, after Harley Bassman and Simplify, launched the Simplify Interest Rate Hedge Strategy (PFIX).  For simplicity, PFIX invests ~50% of its capital into a US Treasury Bond (5-year) and uses the balance to purchase put options at 4.25% on the 20-year rate, expiring in May 2028.  In essence, with the value of the Treasury Bond providing a floor for PFIX should OM be wrong, the option provides substantial upside should long-term rates increase over the next seven years.  (For the curious, or nerdy, page 7 shows the modeled profile)


Performance and Review
OM’s portfolio ended the first quarter +4.45%, after recovering from a terrible start to the year that saw it down over -12.5% for the year in the final week of January.  While equity markets also rallied back from their lows, both the S&P 500 Total Return (-4.60%) and the MSCI World (-4.78%) ended the quarter in negative territory.

First Quarter Attribution


Given the context of everything that happened in the markets during the first quarter, little in OM’s portfolio proved particularly surprising.  The quarter began with questions over whether inflation would prove to be transitory and whether (and by how much) the FED would have to raise rates.  The Russian invasion of Ukraine and subsequent sanctions highlighted and exacerbated the supply-demand imbalances in many commodities, which rose significantly.  This further entrenched the likelihood that inflation would be both greater and more persistent than expected, meaning the FED would have to raise rates quicker or higher (or most likely both) than previously anticipated.

Given all of the above, it’s unsurprisingly that OM’s winners were largely from the commodity and hard asset related investments.   The positions in Uranium (+411bps) led the way, as the case for nuclear power was further underlined as Europe’s reliance on Russian natural gas was made clear.  The quarter saw both France and the UK commit to building more nuclear plants, the US discuss potentially banning Russian uranium and/or tax credits for nuclear power.  OM’s other commodity positions – Tin (+136bps), Commodities (+36bps) and Energy (+44bps) – also contributed to performance.  In particular, the positions in Alphamin Resources (Tin) and Filo Mining (Commodities) were good contributors after both reported positive results in their respective drilling programs.  

Outside of direct commodity exposure, the other winners were also related to the key macro changes.  The Shipping (+238bps) positions in oil and product tankers were direct meaningful beneficiaries of the conflict in Ukraine.  Changes to the efficient flow of oil and its products, leads to extra seaborne miles of travel and higher utilization for the tanker fleets.  This was most cogently demonstrated by Zoltan Pozsar (of CS) who noted that while it's easy to say China will buy Russian crude oil rather than Europe, in the real world just this change would use all the existing ships running the European route and tie up 10% of the VLCC tanker (the largest size of tanker) fleet!  The Short/Hedge (+36bps) directly benefited from the rise in rates, which saw its embedded options become more valuable.  The Idiosyncratic positions (+61bps) also aided performance; both Texas Pacific Land Trust (TPL) and St Joe Co (JOE) are real estate plays.

The detractors from the portfolio were equally unsurprising – growth stocks are long duration assets as their profits/cash flows occur well into the future.  Unsurprisingly, as medium and long-term rates increase these cash flows are worth less today than they were previously.  Three of the primary detractors were Blockchain (-164bps), Biotech (-104bps) and Tech-4th Industrial Revolution (-84bps) which all reflect this concept.  The Funds book (-88bps) was driven by negative performance across the board.   The negative performance from Vietnam (-42bps) and India (-31bps) in part reflected the geopolitics around countries believed to be in China/Russia’s orbit and the possibility of reduced globalization with supply chains moving nearer end customers and to friendlier countries.  Finally, the position in Carbon (-24bps) was a detractor as there was some debate as to whether Europe would pause or waive its cap-and-trade allowance program due to the war in Ukraine.  The position recovered most of its losses by quarter-end; decarbonization is quasi-religious in Europe/California and it will take more than a potential world war to slow it down.

The positions in Greece (+8bps) and Brazil (+12bps) weren’t material contributors, though Brazil – a commodity exporter – rose meaningfully in the quarter.  After a tough couple of years and with an upcoming election and rates nearer a peak than trough, it’s a position that OM is spending a lot of time researching.


Portfolio (as at 03/31/22 - all delta and leverage adjusted, as appropriate)

Dislocations: 41.5%
27.4% - Uranium (URNM, CCJ, NXE, PALAF, DNN, BNNLF and URG)
10.2% - Shipping/Tankers (STNG, INSW, EURN, TNK and DHT)
3.8% - Greece (GREK & ALBKY)

Thematic: 39.1%
9.0% - Tin (AFMJF, MLXEF and SBWFF)
8.3% - Blockchain/Crypto (GBTC, ETHE, and OSTK)
6.2% - India (IBN, INDA and SMIN)
4.9% - Biotech: 4th Industrial Revolution (IBB & XLB)
3.2% - Tech: 4th Industrial Revolution (JD & WCLD)
3.2% - Vietnam (VNM)
2.1% - Carbon (KRBN)
1.7% - Commodities/Mining (FLMMF)
0.4% - Brazil (EWZ)

Technical: 0.0%

Idiosyncratic: 15.8%
10.5% - Funds (ARTTX, CWS, GVAL, and CAPE)
5.3% - Equities (TPL & JOE)

Shorts/Hedges: 2.6%
2.6% - Higher Medium-Term Rates (PFIX)

Cash: 1.0%

Disclaimer:  Nothing above represents a recommendation in any way, shape or form so please don’t even think of trying to take it that way.  For added clarity, while Our Man is invested in all of the securities mentioned that’s a terrible reason for anyone else to do so.  Our Man also holds some cash and a few other securities (of negligible value).  You should not buy any of these securities because Our Man has mentioned them, but should do your own work and decide what’s best for you given your own circumstances/risk tolerance/etc.  


Tuesday, January 25

2021: Fourth Quarter Update

Portfolio Update  

- India:  OM added to the portfolio’s India exposure through bother larger caps (INDA) and smaller/mid caps (SMIN).  OM also added a position in ICICI Bank (IBN).

 - Biotech: While the overall market has been strong, the biotech market has been exceptionally weak.  Our Man took the opportunity to increase his initial starter position through the sector ETFs (both IBB and XBI).  [Editor’s Note: Yup, OM was too early to do this!]

 - Tin: The tin thesis represents OM’s single highest conviction thesis entering 2022, but its size remains constrained by the paucity of ways to express it.   However, OM continued to add to his position in Alphamin Resources (AFMJF).  Alphamin’s Bisie Tin Project is undeniably the single best tin asset on the planet, with ever increasing signs that the deposit is somewhat larger than believed.

Performance and Review 

While OM’s portfolio ended up broadly flat during the fourth quarter, this disguises the sharp swing in performance – by November 9th, OM’s portfolio was up just over 18% for the quarter (and 60%+ for 2022) before giving back all of this performance over the remainder of the quarter. 

OM’s portfolio ended the quarter rising +0.1%, and trailed both the S&P 500 Total Return (+11.0%) and the MSCI World (Net, +8.1%) after losing money during December’s rally.  This meant that OM’s portfolio ended 2021 up +38.1%, though this still outpaced the S&P 500 TR (+28.7%) and the MSCI World (Net, +24.1%).


Fourth Quarter Attribution

OM’s Shipping-Tanker positions (-219bps) were the largest detractor with fears over Omicron’s impact on demand hanging over the names.  This wasn’t the only cause of weak performance as headline rates were already largely disappointing during the seasonally strong 4th quarter.  However, there is a bifurcated market with modern vessels receiving vastly superior rates to more inefficient older vessels.   These discrepancies and the strong steel price meant we finally saw an uptick in the scrapping of older vessels, which is an important factor in balancing the market. 

The largest contributor to performance was OM’s exposure to Tin (+244bps); the metal was one of the best performing commodities in 2021, setting numerous record highs towards year-end.  OM’s stocks couldn’t keep up with the metal price though Alphamin generated substantial profits, now has no net debt and continues to see positive drilling result.  Elsewhere, little has changed with OM’s thesis during 2021 other than further evidence that demand remains strong and key producers are either running out of reserves (Myanmar, 17% of production but only a couple of years of reserves left) or are seeing shifts to more expensive types of mining (Indonesia, the largest tin producer).  

While Uranium (-41bps) was not the biggest detractor during the quarter, it saw the largest intra-quarter swing having been up almost 800bps at one point.  As mentioned last quarter, Sprott completed its transaction for the renamed Sprott Physical Uranium Trust (“SPUT”) and was an aggressive purchaser of Uranium in September and throughout the 4th Quarter.  This saw the Uranium equities rally significantly during the first half of the quarter, before falling back through a mixture of getting ahead of themselves and concerns over the Omicron variant.  Fundamentally, things remain positive with nuclear included in the initial draft of the EU Taxonomy, China indicating it plans to build another 150 nuclear plants over 15-years (i.e. more than the rest of world has in 35-years), and wide scale Western government support for Advanced SMR (small modular reactors).  Though Uranium is OM’s largest position, unlike earlier in the year, it is sized such that OM can stomach the volatility in the space.   OM’s Blockchain holdings (-15bps) also saw significant volatility over the course of the quarter, as both Bitcoin and Ethereum slumped after touching record highs. 

OM’s exposure to the ‘new’ economy was a detractor during the 4th quarter with both the software positions in Tech-4th Industrial Revolution (-38bps) and the Biotech (-55bps) positions hurting.   Software remains an attractive sector in the long-term, and its evangelists speak many truths but it just remains very expensive [Editor’s Note:  Still true, despite the fall so far in January] and thus undersized in the portfolio.   OM’s Energy exposure (-67bps) was a detractor during the quarter. 

The exposure to Funds (+102bps) was positive, as they participated in the market’s rise.  The idiosyncratic exposure (+73bps) was entirely driven by the position in JOE, which continues to successfully develop parcels of real estate in the Florida Panhandle.   Our Man’s broad international exposure in Vietnam (+30bps), India (+2bps), Greece (-5bps) and Brazil (-2bps) was largelyy flat.  Brazil, while the smallest position, is the one where OM is currently spending the most time!  The last two-years have been a terrible time with the impacts of COVID, the Bolsonaro presidency, slowing economic growth, high inflation and interest rates rising (seven consecutive times from 2% to almost 10% during 2021!).  However, this is what makes it an interesting potential dislocation.  We know all of these things but Brazil remains rich in commodities, we are near the end of the rate rising cycle, have an election later in the year, and the equity market is cheap (~8x).

Portfolio (as at 12/31/21 - all delta and leverage adjusted, as appropriate) 

Dislocations: 40.1% 
24.9% - Uranium (URNM, CCJ, NXE, PALAF, DNN, BNNLF and URG) 
8.5% - Shipping/Tankers (STNG, INSW, EURN, TNK and DHT) 
4.0% - Greece (GREK & ALBKY) 
2.7% - Energy (SD)

Thematic: 30.7% 
9.2% - Blockchain/Crypto (GBTC, ETHE, and OSTK) 
8.3% - Tin (AFMJF, MLXEF and SBWFF) 
6.9% - India (IBN, INDA and SMIN) 
6.2% - Biotech: 4th Industrial Revolution (IBB & XLB) 
4.2% - Tech: 4th Industrial Revolution (JD & WCLD) 
3.8% - Vietnam (VNM) 
0.3% - Brazil (EWZ)
 
Technical: 0.0%
 
Idiosyncratic: 15.8% 
12.0% - Funds (ARTTX, CWS, GVAL, and CAPE) 
5.0% - Equities (TPL & JOE)
 
Shorts/Hedges: 0.0%
 
Cash: 3.8%  
 
Disclaimer:  Nothing above represents a recommendation in any way, shape or form so please don’t even think of trying to take it that way.  For added clarity, while Our Man is invested in all of the securities mentioned that’s a terrible reason for anyone else to do so.  Our Man also holds some cash and a few other securities (of negligible value).  You should not buy any of these securities because Our Man has mentioned them, but should do your own work and decide what’s best for you given your own circumstances/risk tolerance/etc.  


Tuesday, October 19

2021 Third Quarter Update

Portfolio Update   
OM made some portfolio sales near the very start of the quarter: 
- Uranium:  OM trimmed his Uranium positon by approximately 1/5, reducing the positions in URNM, CCJ, NXE and URG.  Though OM felt that the launch of SPUT (see below) would have a positive impact, he expected it to come largely after SPUT’s NYSE listing in the US – it came much more quickly.  These positions were in the most established Uranium miners in OM’s portfolio, with the smaller more speculative positions in the theme unchanged.  As a result, the risk in the Uranium theme fell by less than 20%.
 
- Energy:  OM exited the position in Antero Resources (AR), as it reached his fair value target after tripling from his initial purchase price in October 2020.   Unfortunately, it proved too early as the natural gas crisis in Europe saw AR rise rapidly at the end of Q3.
 
- Tankers: OM trimmed his tankers position, through reducing STNG and EURN.  The medium-to-long term prospects continue to look good for tankers on both the demand and supply side.  Demand for oil/oil products is slowly/steadily returning as COVID wanes globally, and the supply book remains tight – owners are finally starting to scrap ships, and the strength in other shipping segments means there will be little room in shipyards for any new tanker orders till after 2025!   However, until demand hasn’t recovered sufficiently for tankers to receive the hockey stick pricing seen in other shipping segments, and after strong performance YTD the stocks were well ahead of rates. 
 
Before making some purchases at the start of September
- Idiosyncratic:  OM added to his position in JOE.
 
- Tin: OM added a position in Cornish Metals (SBWFF) – a junior Tin miner - to the portfolio after it continued to post encouraging results.  Fundamentally, Tin remains OM's highest conviction idea though it lacks Uranium's reflexivity and has limited investment options.
 
- India:  OM added to his India exposure through adding the MSCI India Small Cap ETF (SMIN), reflecting increased willingness to build the position following the delta variant.
 
 
Performance and Review 
The start of the second quarter of 2021 saw the portfolio continue to outperform markets, though this reversed meaningfully in June.  OM’s portfolio ended the quarter rising +6.3%, and trailed both the S&P 500 Total Return (+0.6%) and the MSCI World (Net, +0.6%).  For the year, this leaves OM’s portfolio up +38.0%, with the S&P 500 TR (+15.9%) and the MSCI World (Net, +14.8%). 
(OM: Performance numbers updated.  Apparently automating something is only good if you remember to check it works!)
 
Third Quarter Attribution


The portfolio continued to benefit from its exposure to Uranium (+495bps), which remains the largest position.  The moves in uranium were catalyzed by Sprott completing its transaction for the renamed Sprott Physical Uranium Trust (“SPUT”).  In mid-August, SPUT activated its at-the-money financing facility, which allows it to raise capital (at market prices) when SPUT is trading at a premium to NAV.  This new capital is then used to purchase more physical uranium!  In the back half of the quarter, SPUT raised over $450million and used it to buy almost 11 million pounds of Uranium.   These purchases helped drive the spot price up to almost $50, ensuring full reflexivity as this was reflected in SPUT’s NAV and price, which helped draw further interest (and investment) in SPUT and the Uranium equity ETFs.  Perhaps, even more importantly the long-term contract price also rose materially for the first time in years, to over $40!  OM continues to believe it’s relatively early in the uranium bull market, and the current energy issues are further highlighting nuclear’s importance.   While SPUT continues to raise capital (and a potential Q1-22 NYSE listing will further help) and with seasonal impacts helping uranium, the reflexivity is likely to continue. OM remains quite content to run an over-sized position and weather the volatility that comes with.
 
OM’s exposure to other commodities was also beneficial.  While the exposure to Tin (+63bps) wasn’t a massive driver, the thesis continues to strengthen, is entirely underappreciated, and the stocks are now reflecting but lagging the strong price action in the physical commodity.   With Alphamin Resources (AFMJF) set to announce drilling results as well as become debt free in Q4, it remains the position that OM is most comfortable in.  The small Energy exposure (+185bps) came from Sandridge (SD), which benefited from its fundamental improvements, as well as the sharp run-up in natural gas prices following its decision to remove hedges earlier in the year.  Finally, while not a commodity, OM’s Blockchain positions – especially in Bitcoin (GBTC) and Ethereum (ETHE) – are benefitting from many of the same factors.  In what seems to be a time of rolling bubbles, OM wouldn’t be surprised if cryptos reinflated over the next six months.
 
OM managed to lose money in just about every other position in the portfolio, though most were largely immaterial.  The Technology - 4th Industrial revolution (-3bps) and Biotech (-15bps) are both longer duration strategies, and have both struggled this year.   OM’s position in Oil and Product Tankers (-40bps) continues to bounce around, as oil demand slowly recovers.  While the short-term turn seems no closer, the long-term prospects continue to improve.  The scrapping of older vessels is increasing and new supply continues to dwindle.  The strength in other shipping markets, has resulted in orders for those segments and means that shipyards are being booked into the mid-2020s.  OM’s broad international exposure posted small losses – Vietnam (-29bps), Brazil (-11bps) and Greece (-4bps) – though this was partially offset by the increased India (+27bps) exposure.
 
The largest loss came in the Idiosyncratic bucket (-75bps), with both St Joe Company (JOE) and Texas Pacific Land Company (TPL) detracting from performance.   Though both companies own significant amounts of land in Florida (JOE) and Texas (TPL) there was no specific reason that drove the stocks negative performance.  Finally, the Funds (+15bps) produced a mild positive contribution.


Portfolio (as at 09/30/21 - all delta and leverage adjusted, as appropriate) 
Dislocations: 44.4% 
26.2% - Uranium (URNM, CCJ, NXE, PALAF, DNN, BNNLF and URG)
10.7% - Shipping/Tankers (STNG, INSW, EURN, TNK and DHT)
4.1% - Greece (GREK & ALBKY)
3.4% - Energy (SD)
 
Thematic: 30.7% 
9.3% - Blockchain/Crypto (GBTC, ETHE, and OSTK)
5.0% - Tin (AFMJF, MLXEF and SBWFF)
4.6% - Tech: 4th Industrial Revolution (JD & WCLD)
4.4% - India (INDA and SMIN)
3.5% - Vietnam (VNM)
3.4% - Biotech: 4th Industrial Revolution (IBB & XLB)
0.4% - Brazil (EWZ)

Technical: 0.0%  
0.0% - OEW Technical positions (DDM, SSO, and QLD) 

Idiosyncratic: 15.8% 
11.5% - Funds (ARTTX, CWS, GVAL, and CAPE)
4.4% - Equities (TPL & JOE)

Shorts/Hedges: 0.0%
 
Cash: 9.2%

Disclaimer:  Nothing above represents a recommendation in any way, shape or form so please don’t even think of trying to take it that way.  For added clarity, while Our Man is invested in all of the securities mentioned that’s a terrible reason for anyone else to do so.  Our Man also holds some cash and a few other securities (of negligible value).  You should not buy any of these securities because Our Man has mentioned them, but should do your own work and decide what’s best for you given your own circumstances/risk tolerance/etc. 

Sunday, July 25

2021 Second Quarter Update

Portfolio Update
OM made a number of changes to the portfolio during April with the catalyst being an influx of cash into the portfolio, aka OM’s retirement account, after he changed jobs.  Those changes were recapped here.

Performance and Review
The start of the second quarter of 2021 saw the portfolio continue to outperform markets, though this reversed meaningfully in June.  OM’s portfolio ended the quarter rising +6.1%, and trailed both the S&P 500 Total Return (+8.6%) and the MSCI World (Net, +7.6%).  For the year, this leaves OM’s portfolio up +29.2%, with the S&P 500 TR (+15.3%) and the MSCI World (Net, +14.2%).


Second Quarter Attribution


The portfolio continued to benefit from its exposure to Uranium (+401bps), which remains the largest position.   The trend of positive news flow continued during the second quarter culminating in Sprott Asset Management – a large well-known player in commodity circles – announcing the acquisition of Uranium Participation Corp and the establishment of the Sprott Physical Uranium Trust (“SPUT”).  Sprott will be listing SPUT in New York (likely early Q4), where it has 4 other listed physical metals trusts, and will be marketing it with the ability to raise capital at market prices to purchase more physical uranium!  Most importantly all of these things are happening as utilities are approaching the time when they need to start contracting to meet their future uranium needs.  However, Uranium stocks have run strongly over the last 6-12 months, and in some cases are comfortably ahead of the fundamentals.  While OM thinks we’re still in the early stages of this bull market, he reduced the position in early July by about a fifth.

The Dislocation portion of the portfolio was also aided by Shipping/Tanker (+118bps) and Energy (+128bps) positions, which benefited as economies continue to slowly reopen.  For all the talk of electric vehicles and lock downs, gasoline demand in the US has already returned to record levels.  Much like Uranium, the sharp rally in the stocks is ahead of the fundamentals and led to OM reducing exposure to both these areas in early July.

The sole significant negative contributor during the quarter was the Blockchain theme (-272bps), which gave back slightly over half of Q1’s gains.  The losses came from OM’s positions in Bitcoin (GBTC) and Ethereum (ETHE) partially offset by the position in Overstock (OSTK).  There has been much written about the fall in digital assets, OM merely notes the peak came after a fevered period of speculation and also coincided with the Coinbase IPO, which provided an alternative way for institutions to get broad exposure to digital assets.  The only other negative contribution came from the Idiosyncratic Equities (-6bps).

The remainder of the portfolio posted gains, though largely lagged the S&P 500 as US markets outperformed International markets.  This was most clearly seen in the Funds (+67bps), and the international positions – Greece (+18bps), India (+11bps), Brazil (+10bps), and Vietnam (+51bps).   The 4th Industrial Revolution positions in Technology (+45bps) and Biotech (+2bps) were also contributors.   Finally, the position in Tin (+33bps) contributed healthily though – in contrast to Uranium – the equities failed to keep up with the metal price, which continues to climb to record highs on the supply deficit.


Portfolio (as at 06/30/21 - all delta and leverage adjusted, as appropriate)

Dislocations: 51.2%
29.3% - Uranium (URNM, CCJ, NXE, PALAF, DNN, BNNLF and URG)
13.9% - Shipping/Tankers (STNG, INSW, EURN, TNK and DHT)
4.4% - Greece (GREK & ALBKY)
3.7% - Energy (AR & SD)

Thematic: 28.9%
9.3% - Blockchain/Crypto (GBTC, ETHE, and OSTK)
5.0% - Tech: 4th Industrial Revolution (JD & WCLD)
4.0% - Vietnam (VNM)
3.8% - Biotech: 4th Industrial Revolution (IBB & XLB)
3.8% - Tin (AFMJF and MLXEF)
2.5% - India (INDA)
0.5% - Brazil (EWZ)

Technical: 0.0%
0.0% - OEW Technical positions (DDM, SSO, and QLD)

Idiosyncratic: 15.9%
12.2% - Funds (ARTTX, CWS, GVAL, and CAPE)
3.6% - Equities (TPL & JOE)

Shorts/Hedges: 0.0%

Cash: 4.0%

Disclaimer:  Nothing above represents a recommendation in any way, shape or form so please don’t even think of trying to take it that way.  For added clarity, while Our Man is invested in all of the securities mentioned that’s a terrible reason for anyone else to do so.  Our Man also holds some cash and a few other securities (of negligible value).  You should not buy any of these securities because Our Man has mentioned them, but should do your own work and decide what’s best for you given your own circumstances/risk tolerance/etc.  


Friday, May 28

Portfolio Update: May 2021

After a very quiet Q1, OM made a number of changes to the portfolio during April with the catalyst being an influx of cash into the portfolio, aka OM’s retirement account, after he changed jobs.  Given this, and the portfolio’s strong run over the last ~6mos what better time for a broad update.

In the recent post on Tin, OM mentioned that the largest core theme across the portfolio is things where supply is limited and where there is increasing demand.  This is not a sudden change, and regular readers will know this is a core concept and risk that OM has talked about since the Mid-2020 Portfolio Update.  Today, OM’s exposure to it has increased to over half the portfolio from ~38% in mid-2020, driven by the positions in Uranium, Shipping/Tankers, Tin, and Energy.  This theme is also related to a lesser extent with both  the Equities and Blockchain positions.


Positions (size order, all sizing is as of April 30th)
Dislocation - Uranium: 28.0% NAV
The first few months of 2021 have seen a steady stream of positive news flow and catalysts in the Uranium market.  Most surprisingly, we saw a step shift in attitudes in the West where nuclear power had gone from being on its way out to finding new support as part of a green energy future.  France extended the life of its existing nuclear plants and the EU is poised to declare nuclear as a green investment.  The turnaround in the US was even sharper, with the White House backing subsidies for nuclear power plants to help meet its green goals.  Meanwhile, the developing world continues to build nuclear power plants, most notably in both China  and India.

Two major uranium mines, the Ranger Mine in Australia and the COMINAK mine in Niger have closed in 2021.  Though the closure of these mines had been long flagged, it further reminds investors of the supply issues in uranium.   Supply was also tightened in an unconventional way.  A number of junior mining companies raised capital from the markets with the specific intent to use it to purchase physical uranium! The difficulty that they faced, and the delayed delivery schedules, reflect the paucity of supply especially as the two largest global miners (Cameco and Kazataprom) are also purchasing uranium as a result of reduced production due to COVID-19.
 
Finally, Sprott Asset Management – a large well-known player in commodity circles – announced the acquisition of Uranium Participation Corp and the establishment of the Sprott Physical Uranium Trust (“SPUT”).  Sprott will be listing SPUT in New York, where hit has 4 other listed physical metals trusts, and will be marketing it with the ability to raise capital at market prices to purchase more physical uranium!  Most importantly all of these things are happening as utilities are approaching the time when they need to start contracting to meet their future uranium needs.

Uranium stocks have run strongly over the last 6+ months, and in some cases are comfortably ahead of the fundamentals.  However, OM’s belief is that we’re still in the early stages of this bull market and that the volatility should be weathered.

The majority of OM’s holding is in URNM, a well-constructed uranium ETF.  Additionally, OM holds about 25% of his exposure split between CCJ (the largest western producer) and NXE (which owns the single best uranium asset globally).  The balance is split between four junior miners (PALAF, URG, BNNLF and DNM) who are in various stages of production.


Dislocation – Shipping/Tankers: 12.9% NAV
Not much new to report on tankers; rates are between bad and dreadful but as the world moves towards reopening and normality the demand for oil is increasing.   The order book remains exceptionally low, especially for product tankers, and with steel prices increasing there is added incentive for owners to scrap old tankers.  OM's position is reasonably evenly spread across five shipping names (EURN, STNG, TNK, DHT and INSW, which replaces DSSI as the companies are merging).  This combination gives OM a little more exposure to product tankers (which carry petroleum products, such as gasoline, diesel fuel, etc.) than crude oil tankers.


Theme – Blockchain: 12.2% NAV
The volatility in digital assets over the first four months of the year has seen the two listed closed-end trusts move from trading at premiums to their value to trading at discounts to NAV.  OM took advantage of this by retaining the same direct exposure to digital assets but broadening it by adding a smaller position in ETHE (Grayscale Ethereum Trust) after it fell from trading at a healthy premium to a small discount.  To compensate for his new position, the existing position in GBTC (Grayscale Bitcoin Trust) was reduced.  

While digital assets have, and will likely continue to be, exceptionally volatile it works in both directions meaning that the management of position sizes really matters.  As a reminder, OM’s approach to digital assets in this portfolio reflects a shorter-term public market view of the investments rather than any longer-term opinion on the digital assets.  To this end, the portfolio construction reflects (i) a broad band of exposure to these assets (currently 6-10%), (ii) that this band will both be reduced and narrowed during 2021, and (iii) OM wants to capture the broad upward trend but also be diligent about taking profits (i.e. think something similar to a trailing stop once the position grows beyond the upper band).  So far, it has worked reasonably well with OM having crystallized so much profit that even if GBTC and ETHE fell to $0 tomorrow, it would still have been a healthily profitable investment.

OM also re-entered his position in OSTK; the broad concept is similar to OM’s original write-up but the changes in management have had  a material impact.  Though the share price is much higher than when OM originally exited, the business prospects for the retail business have improved markedly and there is significantly less uncertainty around the digital assets.  The core online retail business is better managed and took advantage of the shifts due to COVID.  It has grown significantly and unlike many online retail businesses it is profitable!   Overstock’s array of investments in digital portfolio companies is also now being professionally managed after a transaction with Pelion Venture Partners.  The deal allows Overstock to participate in most of the upside, while also retaining direct stakes in certain of the companies (most notably tZERO, a SEC and FINRA regulated trading platform for digital assets!)


Equities - Funds: 12.6% NAV
No changes.


Theme - 4th Industrial Revolution: 8.6% NAV
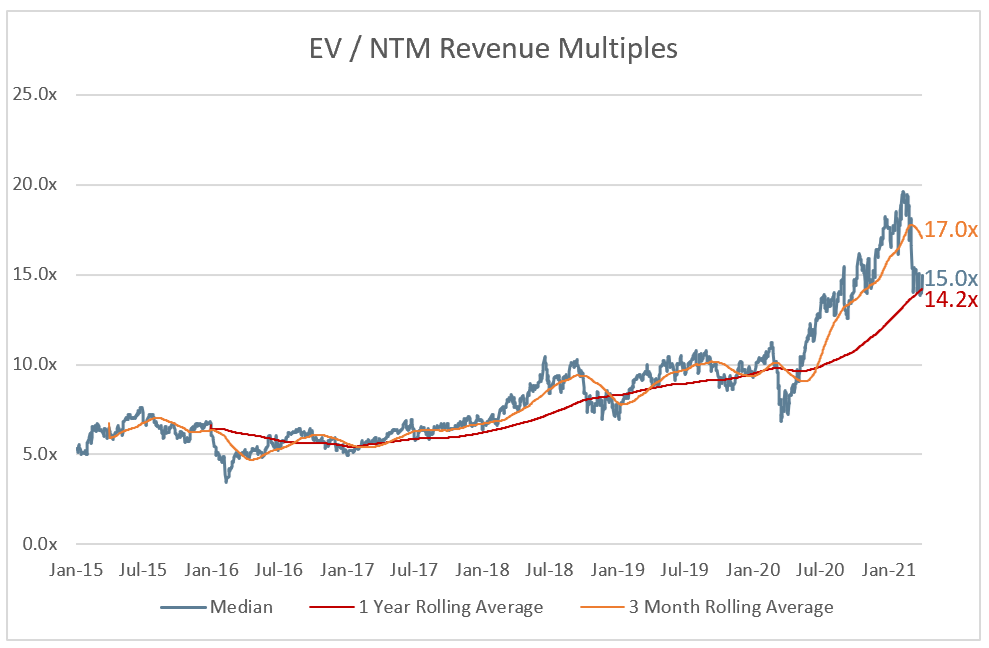
One of the things that has become apparent over the last year is that the future is arriving quickly; both in terms of technology and biotech.   On the technology side, much of what OM wrote last June still holds true; the thesis for SaaS (part I and part II) is largely unchanged and the pandemic has hastened the transition to cloud services.  However, the median SaaS company trades at 14x its revenues over the next 12M - something that is hard to justify.  As such, the exposure to technology has continued to slowly shrink and is now ~5%.

After five years of not doing a whole lot, biotechnology finally broke out in 2020 and surpassed its 2015 highs.  The genomics revolution began in April 2003 when the Human Genome Project – an international scientific research project seeking to determine the DNA sequence of the entire euchromatic human genome – was declared complete.  It took a leap forwards around 10-years ago with the emergence of CRISPR, and the ability to sequence and edit genomes.  The cost of this sequencing and editing has fallen significantly over the last decade.  While there are many legitimate debates and questions about the mRNA vaccines (Pfizer and Moderna) and their approval process, these vaccines are also clear beneficiaries of much of this work over the last decade and the first of their ilk.  This coupled with the speedier approval process and renewed interest in the space, means OM has taken a small position (~4%) through the biotech etfs.


Themes – Vietnam, India and Brazil: 7.7% NAV
Unsurprisingly, given the very long-term horizon it is unchanged from when OM wrote about it 18 month ago

Dislocation - Greece: 4.9% NAV
Following New Democracy’s impressive win in the 2019 Greek elections, things were looking up for Greece.  New Democracy inherited an economy that was rebounding and OM’s expectation was that a business-friendly government would help change the narrative around its recovery and draw investor interest.  The new government started well by persuading the EU to allow Greece to cut taxes and making reforms in order to reduce the primary surplus that the Greek government was mandated to run.   However, the arrival of COVID overshadowed all of Greece’s progress and dealt PM Mitsotakis’ government an abysmal economic hand.  The signs of the new government’s competence remain; it has managed the crisis better than most of Europe, and recently submitted a detailed national recovery plan to the EU that has already drawn positive initial evaluations.


Idiosyncratic - Equities: 3.8%
OM holds a couple of small real estate related positions. 
Texas Pacific Land Corp (TPL) was a publicly traded land trust, with land in the Permian basin that benefits primarily from oil & gas royalties from the drilling/pipelines/etc. on its land and from a smaller but growing water business.  The trust was historically self-liquidating, using its excess cash to buy back shares, but finally converted itself to a C corporation earlier in 2021.

The St. Joe Company (JOE) owns approximately 175K acres in the Florida Panhandle.  The stock was a hedge fund battle ground a half decade ago, with bulls arguing it traded for a fraction of its future value and bears saying the land just wasn’t worth much (and there would be limited future value, as nothing significant would be built).   They were both kinda right but on different time horizons - the bears in the short-term, the bulls in the longer-term – and the stock has gone sideways for much of the last decade.  Today, the population in the Panhandle has hit critical mass and JOE is now benefiting from the broader infrastructure on its land and increased building (at attractive prices).  COVID has further sped up the trend.


Theme – Tin: 3.1% NAV
OM recently wrote about Tin, and has subsequently continued to add to the position in Alphamin Resources (AFMJF) that makes up the vast majority of the tin exposure.


Theme - Energy: 2.4% NAV
OM has dipped his toe in Energy, through positions in two natural gas plays (AR and SD) who have both managed their businesses well during the turbulent times.  Longer-term, OM remains interested in the offshore oil services sector but has no current positions.


Cash: <5% NAV


Disclaimer:  Nothing above represents a recommendation in any way, shape or form so please don’t even think of trying to take it that way.  For added clarity, while Our Man is invested in all of the securities mentioned that’s a terrible reason for anyone else to do so.  Our Man also holds some cash and a few other securities (of negligible value).  You should not buy any of these securities because Our Man has mentioned them, but should do your own work and decide what’s best for you given your own circumstances/risk tolerance/etc. 

Wednesday, May 5

The Adventures of Tin(tin)

The largest core theme across OM’s portfolio is things where supply is limited and where there is increasing demand.  Most obviously, you’re probably sick of hearing OM harp on about the supply deficit in Uranium, while new nuclear power plants are being built in the developing world and existing ones having their lives extended in the developed world.  However, it’s more pervasive than just Uranium – you see it in Shipping/Tanker (record low order books coupled with increasing tonne miles), or in some equities (TPL/JOE own specific plots of land, i.e. supply is fixed and they are seeing increased demand for its use), or even Bitcoin (slowing rate of supply, coupled with increased demand from investors/institutions), etc.
 
COVID-19 has brought many of these situations to the fore as demand is recovering far more quickly than supply can adjust.  This is particularly the case in commodity-related sectors, especially where there have been years (or decades) of under-investment that have led to structurally under supplied markets.  Unsurprisingly, OM has focused his attention on the markets where long-term demand growth is combined with a structural supply issue.  
 
The tin market is one of the clearest examples of this.  Tin is the smallest of the base metals markets and is used across a wide variety of products (i.e. the opposite of uranium, which has one use) and thus typically ignored by investors.  Tin is often also used in tiny quantities in products – there are a couple of grams of tin costing <15c in your iPhone – but typically has no substitutes thus demand is very price inelastic.  Tin also has a crazy history on the supply side with failed CIA stockpiling and a collapsed cartel resulting in oversupply for almost 45-years.  All of the major suppliers are seeing substantial declines in their output, with most of the efficient and cheap to access tin having already been mined.  Finally, though Western investors have limited ways to participate in the tin market, one is the producer with the best global tin deposit!
 
Demand for Tin 
The potential long-term demand growth is the easy part of the equation for Tin. Tin’s primary usage is in solder, especially as the ‘glue’ for semiconductors.  Tin is also used in chemicals (as a stabilizer in plastics), tin plate (tin cans), float glass (i.e. your windows, as tin is vital to the Pilkington process) and in batteries (for EVs), but typically makes up a small but vital component of the overall systems in which it is used.  For example, a ‘tin can’ contains only 1-2% tin or an iPhone contains a couple of grams of tin yet it’s vital for the electronics and touch screen to work.  This means demand for tin is largely price insensitive.
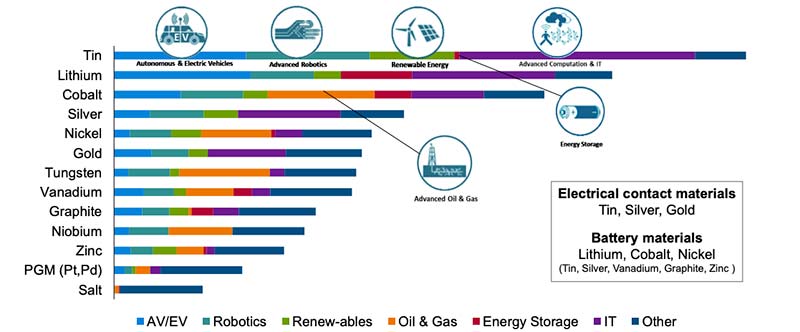
Tin’s primary use is for solder, especially in semiconductors where the electronic solder (which is 95% tin) joins the components.  Over the last 15-yrs, despite the growth in electronics the demand for solder was constrained by miniaturization, i.e. the semiconductors in your phone became ever smaller requiring less solder.  However, expected demand growth from the increased semiconductor content within electronics (phones, cars, etc.), as well as the growth in electronic technologies (think 5G and the “Internet of Things” or “4th Industrial Revolution”) is an order of magnitude higher than the loss from miniaturization.  Tin is also vital to to new technologies, such as battery technology, robotic and electric vehicles, which was highlighted in an MIT study of key new technologies and the metals required.


Supply 
Tin has been recognized as a strategic metal since it was first combined with copper to create bronze leading to the whole Bronze Age period!  This strategic importance, combined with being the smallest of the metal markets (~300,000 tonnes annual production) has resulted in a crazy history!
 
After WWII, the CIA identified tin as a strategic metal that was required for artillery and naval guns, and early electronics, and which the Soviet Union was entirely reliant upon imports.   This led to the US Defense and Logistics Agency (“DLA”) aggressively procuring tin until 1960, such that in thirteen years it had acquired over 350,000 tonnes of tin, or three-years of global annual production at the time!  The DLA eventually gave up as its purchases had squeezed supply, causing price to rise and pushing the Soviets into major exploration, production and eventual self-sufficiency.  The DLA subsequently liquidated this tin inventory and it took them until 2006 to do so.  This huge forty-five year (!!!) secondary supply overhang limited the need for new tin exploration and production during this period.  
 
While this was all happening the International Tin Council was created in the late 1950s.  Over the course of twenty-five years, six separate International Tin Agreements were signed by thirty countries to limit production.  While a key aim was to reduce fluctuations in the tin price, the majority of the members were producers and so the agreements contained increases in the targeted tin price.  However, by 1985 the ITC ran into soft demand (damn aluminium cans!) and new tin discoveries in non-member countries (primarily Indonesia and Peru).  This coupled with quota busting by ITC members led to a vastly oversupplied market and the ITC collapsed into bankruptcy in 1985.  In its attempts to hold the tin price up, the ITC had run up liabilities of just under $1.5 billion (in 1985 dollars!!!) and held over 120,000 tonnes (or eight month’s global supply) of physical tin, as well as additional derivative purchases.
 
During the 1990s and 2000s while the DLA and ITC were slowly liquidating their tin inventory and China and Indonesia were ramping up their tin production the market was in surplus.  This meant that the tin price was depressed and there was no incentive for producers to look for tin.  After the secondary liquidations finally finished in the mid-2000s, the tin price rose only for Myanmar to plug the under-investment gap after ramping up production in the 2010s.  China and Indonesia are the two largest producers in the market today, each representing 25% of supply, though production is down significantly from its highs.  Myanmar represents 17% of global tin production and will have run out of tin in 2023!!  
 
Finally, there’s a wrinkle in the way that tin is mined.  The cheapest and most efficient way of mining  tin is alluvial mining, where a river or stream bed is mined for deposits.  This can be done artisanally in a similar way to gold pan-handlers and on a more commercial basis through dredging.  However, the best alluvial mining sites (e.g. Myanmar, Malaysia, and Indonesia) have all seen significant production declines as they have mined most of their resource.  This means future tin production will come from underground (hard rock) mining, which is more expensive, difficult and capital intensive and requires a significantly higher tin price.
 
In summary, you have a potential perfect storm for a non-linear rise in the tin price.   On the supply side you have a market where massive secondary supply has limited exploration over the last 50+ years, existing suppliers are running out of material, and where the only viable method of mining is vastly more expensive and less efficient.  At the same time, you have a material that is a tiny but key and not substitutable component of almost its entire end demand, and where technological changes are driving material demand growth in the coming years.
 
How is OM expressing it? 
For Western investors there are currently only 2 investable producers; Alphamin Resources (AFMJF) and Metal X Limted (MLXEF).  The difference between the two companies is stark!  
 
The majority of OM’s exposure is to Alphamin Resources (AFMJF) who own ~80% of the Bisie tin mine in the Democratic Republic of Congo (“DRC”).  Bisie is THE premier tin asset globally.  It has the highest grade resource of major mines globally, is a lowest quartile producer, and currently produces about 4% of global supply (it is 8% of global reserves), with near term ability to expand production. 


Alphamin is significantly cash generative at today's tin prices and is using its free cash flow to pay off its external debt (OM’s back of the envelope model suggests it’ll be debt free before year-end) and then potentially pay a dividend.   The company has benefited from upgrading management at both the corporate and mine levels, and at today's tin prices will be generating close to  a fifth of its current market cap in free cash flow this year.  However, the single mine and DRC-related risks limit OM’s position size, though it should be noted that the DRC Government has a 5% stake in the mine.
 
Metal X (MLXEF) is Australia’s largest tin miner but is a marginal producer that expects to mine 10K tonnes of tin by 2025 and can barely make money even at today’s rising tin price.  It is thus riskier and far more levered to a higher tin price, and as such a tiny position for OM. 


Disclaimer:  Nothing above represents a recommendation in any way, shape or form so please don’t even think of trying to take it that way.  For added clarity, while Our Man is invested in all of the securities mentioned that’s a terrible reason for anyone else to do so.

Wednesday, April 14

2021 First Quarter Update

Portfolio Update 

OM made limited changes to the portfolio during the first quarter, as an influx of cash is expected early in the second quarter.  Expect a portfolio update when it’s put to work. 
 
- Uranium: OM added a small position in Paladin Energy (PALAF).  Paladin was one of the very few successes of the last Uranium bull market, meaning it actually built a mine.  Paladin is a mid-tier producer and would be one of the first uranium companies that could bring back capacity if prices rose to more economical levels. 
 
- Tin:  OM began a thematic position in Tin!  It’s another area of the market that’s seeing constrained supply, but also has the tailwind of attractive demand dynamics (think 5G, EVs, etc.).   Expect something more substantial in the coming weeks.

Performance and Review

The first quarter of 2021 proved to be a continuation of the final couple of months for OM’s portfolio, which climbed +21.9%.  This handily outpaced the S&P 500 TR (+6.2%) and the MSCI World (Net), which rose +6.1% 
 
The last 15 months have been a strange time for OM’s portfolio; after losing 31% in the first 10 months of 2020, the portfolio has gained 65% in the last five months!  However, the power of that initial negative compounding can be seen as the portfolio is only up ~15% over that period.  As such, despite handily outperforming the S&P 500 TR and the MSCI World (ND) during the first quarter, the portfolio trails them since the start of 2020.
 

First Quarter Attribution


The portfolio primarily benefited from its exposure to uranium, cryptocurrencies and energy during the first quarter.  Uranium (+749bps) remains the largest position and is benefiting from what Justin Huhn has dubbed the “flywheel effect"; news flow is positive, which is opening the sector up to more investors, which is leading to further positive news flow, which is…and on.   We saw confirmation of the West’s changing views with France extending the life of its oldest power plants, the previously anti-nuclear Democrats including nuclear in their clean energy standard, and EU experts saying nuclear qualifies for green investment label.  Investors responded by increasingly investing in the sector (e.g. the major ETFs saw significant inflows), which allowed a number of junior uranium miners to raise capital backed by institutional demand.  To the surprise of the market (and OM) a number of these junior miners used the proceeds to purchase physical uranium, further tightening supply!
 
OM’s position in Blockchain/Crypto (+484bps) contributed well a Bitcoin rose strongly at the start of the year.  As mentioned last quarter, while digital assets continue to benefit from the increased institutionalization of the ‘asset class’ they also capture the zeitgeist of the moment.  Bitcoin, in particular, remains the logical extension of almost everything various market factions currently believe!  This will change.
 
The energy exposure was the most subtle of these, indirectly aiding the positions in Shipping/Tankers (+460bps) and Idiosyncratic equities (+367bps) while more obviously helping the Energy (+94bps) position.  In Shipping/Tankers, the rates for oil tankers (which transport crude oil) remain terrible though those for product tankers (which transport petroleum-related products) have improved markedly.  There is increased optimism amidst signs that many economies are slowly heading towards reopening in the middle of the year.   In Idiosyncratic equities, the position in Texas Pacific Land Corp finally completed its conversion to a corporation from a trust which removes some of the company’s idiosyncrasies and opens it up to a wider shareholder base.   However, given its extensive land holdings in West Texas it was also a beneficiary of increased activity in oil/gas markets.   Finally, the position in Antero Resources (AR) benefited from the healthy natural gas price, and the good moves the company made throughout 2020.

The rest of the portfolio was largely a wash.  The Funds (+57bps) participated in the market rally, and India (+15bps), Vietnam (+13bps) and Greece (+14bps) contributed moderate gains.  The Technology: 4th Industrial Revolution holdings (-55bps) gave back gains; as the chart below shows, the Software-as-a-Service (“SaaS”) names had become severely over-extended with the median SaaS company trading at 20x NTM Sales!   Brazil (-5bps) and Tin (-6bps) were marginal detractors.

Source: Clouded Judgment (a blog all interested in SaaS should follow!)

Portfolio (as at 03/31/21 - all delta and leverage adjusted, as appropriate) 

Dislocations: 45.8% 
25.7% - Uranium (URNM, CCJ, NXE, PALAF and URG) 
14.5% - Shipping/Tankers (STNG, DSSI, EURN, TNK and DHT) 
3.5% - Greece (GREK & ALBKY) 
1.7% - Energy (AR)
 
Thematic: 21.3% 
9.3% - Blockchain/Crypto (GBTC) 
4.9% - Tech: 4th Industrial Revolution (JD & WCLD) 
3.2% - Vietnam (VNM) 
2.7% - India (INDA) 
1.0% - Tin (AFMJF 
0.5% - Brazil (EWZ)
 
Technical: 0.0%  
0.0% - OEW Technical positions (DDM, SSO, and QLD)
 
Idiosyncratic: 17.4% 
11.9% - Funds (ARTTX, CWS, GVAL, and CAPE) 
5.5% - Equities (TPL)
 
Shorts/Hedges: 0.0%
 
Cash: 16.0% 


Disclaimer:  Nothing above represents a recommendation in any way, shape or form so please don’t even think of trying to take it that way.  For added clarity, while Our Man is invested in all of the securities mentioned that’s a terrible reason for anyone else to do so.  Our Man also holds some cash and a few other securities (of negligible value).  You should not buy any of these securities because Our Man has mentioned them, but should do your own work and decide what’s best for you given your own circumstances/risk tolerance/etc.