Pages

Showing posts with label Tin. Show all posts

Tuesday, December 24

Things from my Newsblur; 2024 Part III

Some final things from my Newsblur to finish up the year, including helpful 2025 advice (from Cal Newport) and additional information on the development of the core theses in Uranium and Tin.   I hope everyone has a happy holidays, and a great 2025! 


How to Stop Being Lazy and Get More Done
For OM – and I’m guessing most of you – time is the primary constraint and to the to-do list never seems to shrink!   As OM tries to figure how to get more done, Cal Newport has become essential reading.  Here Erik Barker breaks down 5 of Cal’s secrets to better managing time and getting more done.   
(Erik Barker, Barking Up the Wrong Tree) 


The Tao of Cal
If the above piqued your interest then read on!  Cal Newport has proposed a lot of ideas on how the digital environment impacts our lives, both professionally and personally, and how we should respond.  This article serves as a primer that summarizes all of his major ideas.  There are some good new year resolutions in there, and it’s an article that OM is likely to come back to many times in 2025.
(Cal Newport, on his blog - one of the few you should regularly read, even if you don't use Newsblur!) 


Why luxury cheese is being targeted by black market criminals
An article inspired by the Neal’s Yard Dairy theft of £300,000-worth of high-end cheddar cheese!  It’s not just British cheddar; cheese theft has become a thing over the last few years as the price of cheese has risen, and with organized crime infiltrating the food industry.
(Dan Saladino, BBC)


What If We Run It Hot….?
For all of OM’s professional life central banks been focused on inflation - especially consumer price rises - over almost everything else.  While many of us, especially in Finance, are happy to ignore both the implied and the unintended consequences of this, the political costs are now beginning to be felt.   With the return of President Trump to the White House, Kuppy looks at what might happen if they economy is allowed to run hot and generate higher than normal inflation.
(Harris Kupperman, Praetorian Capital) 


The Eucalyptus Tree Goes to the Moon: The Koala’s Visit to Goma & the Bisie Tin Mine
OM’s day job means he cannot visit the companies he owns, let alone do site visits for some of the mining names.   In the case of Alphamin Resources this matters; the broad thesis is clear, the asset quality isn’t disputed, but it’s located in North Kivu, in the Democratic Republic of Congo.   Fortunately, while OM can’t go visit the site it helps to know folks who can – so if you’ve ever wanted to know more about Alphamin's actual mine, this is the article for you.
(The Koala, Substack) 


Repositioning in Uranium
OM’s largest position is still in Uranium.   Trader Ferg gives a good update on Uranium markets, including recapping the simple thesis behind the investment and the incremental positive changes that have occurred in recent years.   While the Uranium opportunity has seen the easy money made, the next leg of the move is substantially less risky than it was a few years ago.
(Trader Ferg, Substack)

Thursday, May 30

Portfolio Update: May 2024 - Part I - There's a Supply Deficit

OM was starting to write a short note on the current market environment, but finds those notes dull to consume and OM has little original to say. Broadly, OM’s market view can be summarized as  - things aren’t as good as we’d like but not as bad as people think, though inflation is likelier stickier than the Fed would care to admit.

However, Our Man has made several meaningful changes to the portfolio over the last few 6 months, largely reflecting opportunities that he’s been watching for a while.  As such, it’s probably a good time for a portfolio update – in two parts, so it doesn’t become too long and unwieldy.

Portfolio Update – Part I – There’s a Supply Deficit
The broadest theme across OM’s portfolio is that of a supply deficit; primarily where an under-investment in supply coupled with a slight growth in demand has resulted in the supply deficit.   The theme is most obviously seen across numerous commodity markets, which represent about 1/3 of OM’s exposure.   More generally, this is something that impacts physical markets (commodities, goods, etc) and because of the rise of digital/software driven business models over the last decade+ OM think investors are poor at truly understanding the impacts.   One of attractions of digital/software business models is that marginal cost is (almost) zero and supply is (almost) unlimited.  For example, if I want to use Microsoft Office on my computer, the cost is almost nothing to Microsoft and my usage has no negative impact on your use of Office on your computer.  However, this doesn’t hold true in the physical world – if I use this barrel  of oil then you cannot, and if there is a supply deficit we are effectively competing to use that barrel of oil leading to a very different impacts on price.

Uranium (24.3%) remains OM’s largest position as it is the purest expression of the supply deficit.  Given the 7-year plus time horizon to successfully permit, build and begin to operate a uranium mine, the supply side is relatively easy to project.   Uranium’s sole end use is as they key component in fuel for nuclear power plants, who purchase it under long-term contracts.   Over the last few years, OM has noted the sharp turnaround in sentiment towards nuclear power.  This has seen nuclear power become accepted as part of the clean energy solution (including within the EU’s green taxonomy/bond program), increased uranium demand through life extensions for nuclear plants (even in the US!) and plans for new plants globally.   This imbalance of projectable supply and increasing demand has not gone unnoticed by the markets with both the Uranium price and the mining stocks up multiples over the last few years.  Despite this, OM retains a sizable position believing that while we’ve reached the ‘end of the beginning phase’ there remains further to go.  Why?  The largest miners keep missing production targets, the best assets keep extending their timelines to start production, the US is determined to wean itself from Russian uranium fuel, the continued nuclear plant extensions and starts bolster demand, and finally the largest banks are only now starting to cover the sector.

OM sees similar dynamics are playing out across Commodities/Mining (1.3%), and in particular in the smaller Tin (7.8%) market.  The supply deficit in the Tin market continues to edge closer as supply in Indonesia & Myanmar – major tin producers – run into problems.  The demand-side case continues to strengthen; as a reminder, ~50% of Tin demand is as solder, primarily as the ‘glue’ to make semiconductors – it is a direct beneficiary of the emergence in AI, and the subsequent demand for AI chips and increasing computing power.   Furthermore, Tin has no substitutes in the production of semiconductors, and has a no impact on the price of the end goods – the iPhone contains <25c worth of Tin, but wouldn’t work without out it.  If the tin price increased by multiples, it has almost no impact on end demand.   Finally, while commodities aren’t a core driver of the Brazil (4.7%) thesis, they are a meaningful contributor given the country (and its companies) are a major supplier of many commodities.   OM suspects that we’re seeing the impact of supply deficits in Uranium ahead of in other markets given the simplicity of its story.  As such, it’s likely that as OM’s exposure to uranium decreases over time, much of that capital will find its way into other commodity-related themes that are only starting to recognize the supply deficits in their markets.

Outside of commodities, the impact of limited new supply and increased demand is also clearly visible in Shipping/Tankers (12.1%), where positions have rallied strongly over the last 3-years.  This originally began due to the IMO 2020 changes but has been supercharged as a result of the Russia/Ukraine war.  We’ve previously discussed its impact on the demand side, but the sanctioning of tankers has also reduced supply.   The Russia/Ukraine war has had the effect of highlighting and exacerbating the imbalances in the tanker market, pulling some of the performance forwards and OM expects the position to continue to shrink over the short-to-medium term.

Elements of the supply deficit dynamic also help underpin some other positions including Idiosyncratic Equities (5.7%), Carbon Credits (2.3%) and Blockchain/Crypto (3.8%).  Both idiosyncratic equity companies (TPL and JOE) own real estate where there is increased demand for its usage be it through oil/gas drilling in the Permian (TPL), or increasing population and build out in Northwest Florida (JOE).  California Carbon Allowances are a man-made ‘environmental commodity’ where regulation specifically targets reducing supply over time to drive the price higher.   Finally, OM has added to the Blockchain/Crypto position – while the Bitcoin halving slows future supply, OM suspects that this 12-month post-halving cycle will be driven by Institutional FOMO (vs. prior halvings’ retail FOMO) now that exposure can be more easily obtained via ETFs.   

Part II will look over the rest of the portfolio...


Disclaimer:  Nothing above represents a recommendation in any way, shape or form so please don’t even think of trying to take it that way.  For added clarity, while Our Man is invested in all of the securities mentioned that’s a terrible reason for anyone else to do so.  Our Man also holds some cash and a few other securities (of negligible value).  You should not buy any of these securities because Our Man has mentioned them, but should do your own work and decide what’s best for you given your own circumstances/risk tolerance/etc.

Wednesday, September 21

Portfolio Update – September 2022

A small note on the current environment and market; economic conditions are uncertain and are being impacted by a cross-current of conflicting short and longer-term trends.  These include the consequences of the COVID-19 lockdowns and the subsequent multi-speed re-openings, the varying amounts of fiscal and monetary support provided during COVID, a decade+ of loose monetary policy, and rising inflation caused in part due to supply constraints and as a result underinvestment in commodities that have been exacerbated by the Ukraine/Russia conflict.  As a result, there has been contradictory signals across countries and within different parts of the economy and markets, meaning there are a broad range of outcomes for both growth and inflation and there is data to support almost any view.

Market wise this has led to increased uncertainty and higher rates, which have been bad for stocks and credit.  It has also seen a tendency for the market to extrapolate limited datasets to smooth the uncertainty but then have sharp reversals when contradictory data comes out.  This is further compounded by the uncertainty over the Fed’s preference function due to the absence of inflation over a prolonged period.  What matters most to the Fed between inflation, financial sector stability, economic growth/unemployment, currency strength/stability, etc. and by how much?   

OM’s market view can be summed up as 🤷 with reasonable cases able to be made for almost any stance.  However, Our Man made several changes to the portfolio in early September.  These largely reflected some structural things that OM has been pondering a while with the most notable being profit-taking in Shipping/Tankers and the elimination of the Funds bucket of the portfolio.

For a broader round-up, and thoughts on the various buckets, please see below:

Uranium: 25.4% NAV
Marginal change, through the reduction in the Paladin Energy (PALAF) position
Since its inception, the uranium position has primarily been about the supply deficit and how higher prices would be needed to encourage greater supply.  While there have been signs of changes in the perception of nuclear generation and potentially increased demand (i.e. new power plants) over the last couple of years, the conflict in the Ukraine and resulting energy issues have acted as a catalyst and brought things to the fore.   So far in 2022, we have seen the UK lay out a strategy to build 8 nuclear power plants, Japan signal a return to nuclear power, the US further support its nuclear plants including the Inflation Reduction Act and California trying to u-turn on closing the Diablo Canyon nuclear plant, not to mention a spate of plans for small-modular reactors in Europe.  This unexpected increase in future demand merely underscores the supply deficit and potential upside for uranium.


Shipping/Tankers: 12.6% NAV
Major change through sale of ~40% of the position across all names
The decision to trim the position was relatively easy as OM the Shipping/Tankers position is up 100%+ in 2022.   Tankers have been a significant beneficiaries of the energy market turmoil caused by the Ukraine/Russia crisis.  As simple example, pre-conflict a small Aframax tankers would fill-up in Russia make the short run to Europe (Rotterdam) and then head back to refill.   Due to the conflict this has become something akin to a couple of Aframaxes fill up in Russia, head out to sea to a ship-to-ship transfer to a larger VLCC, which then travels all the way to India or China (and back again), while other tankers service Europe with oil from the US or Middle East.  While this is a massive simplification it’s a good demonstration of how inefficient today’s reality is compared to pre-conflict!   Tankers are traveling a lot of extra miles and with fixed supply, unsurprisingly price is the variable that has changed.

So why keep the position (and in larger size vs. end-2021).  The tanker fleet is getting old and the order book is the lowest since 1996 so supply will be constrained for a long time.  Furthermore, while Tankers will be hurt if/when there’s a resolution in Ukraine and/or a recession, we’re also unlikely to revert to the pre-crisis trade routes.  This is especially the case when we look at where the oil is being exported (US oil production/exports near all time highs), where the refineries are and where the end consumers are.  

Given the above, OM leans to the view that the dislocation phase of the tanker trade is over, and the tanker market super cycle is finally beginning.  To reflect this, OM will move Tankers from dislocation to thematic at year-end.  The operating and financial leverage (and shady management) in the businesses means it won’t be smooth sailing and the position sizing reflects that and the thematic nature.   


Tin: 8.3% NAV
Minor change through increasing the position in Alphamin Resources (AFMJF)
The tin price has been very volatile over the last year; the current $21K price is down over 50% from its 2022 peak yet also near historical pre-COVID highs.  However, there’s been little change to the long-term outlook and the same demand-supply dynamics remain (https://ourmaninnyc.blogspot.com/2021/05/the-adventures-of-tintin.html).  OM took the opportunity to add to the Alphamin position; it is a largely debt free company that’s profitable at these prices as the lowest cost major producer, and it also has the largest untapped tin deposit adjacent to its existing mine.

 
International: India (6.7% NAV), Greece (3.5% NAV) and Brazil (2.2% NAV)
Minor change, exiting Vietnam but adding to Brazil
The position in Vietnam was exited – while Vietnam will benefit from supply chains being diversified from China, it’s more likely that many of these supply chains will be brought back to Americas than prior to COVID/Ukraine.

OM added to the position in Brazil – it’s a commodity rich country, with a cheap market, where interest rates (at 13.75%, from 2020 lows of 2.00%) are nearer the end of their cycle and with a pivotal election later this year.  It’s something OM continues to spend more time on, and if it’s going to be sized up meaningfully then OM will write in greater depth.   OM is additionally looking at Turkey, as a potential investment idea.

 
Equities/Funds: 5.6% NAV
Major change: exited all of the Funds’ positions (GVAL, CWS, ARTTX, and CAPD) and added marginally to JOE.
The biggest change to the portfolio was OM exited the Funds’ positions.  This is something that OM has been toying with for much of the last year – the positions were introduced a while ago to provide some consistent equity exposure as OM was chronically underinvested.  Today, OM has vastly more ideas, greater conviction in them, and a better understanding of his own investment style.  As such, there’s somewhat less need for the Funds positions and their capital will be allocated elsewhere.


Software/Tech (2.8% NAV) and Biotech (5.0% NAV)
No changes, though both Software and Biotech are approaching levels that are beginning to get attractive.


Carbon Credits: 0.0% NAV
OM exited the position in Global Carbon Credits (KRBN)
While OM is intrigued by the Carbon Credits space, in part because it would take a material event to push Europe and California away from believing their carbon cap-and-trade systems were part of a green solution.  Unfortunately, the Ukraine conflict and its impact on energy and electricity prices in Europe is such a material event.  With Europe representing 50-60% of KRBN and a debate beginning to emerge (https://www.euractiv.com/section/emissions-trading-scheme/news/eus-von-der-leyen-rebuffs-polish-call-to-suspend-carbon-market/) over pausing Europe’s cap-and-trade system, OM decided to exit the position.  However, you should expect to see it back in the portfolio in the future though it may be expressed differently (e.g. KCCA, which just reflects California’s Carbon Allowance system and is trading much more attractively).


Blockchain: 4.1% NAV
Marginal Change; exited Bitcoin (GBTC) but added to position in Overstock (OSTK)
OM was long overdue in exiting the Bitcoin investment, which turned a great profit into a healthy one.  The capital was largely reallocated to the position in Overstock (OSTK).  The broad outline of the case for OSTK is largely unchanged since OM’s original write-up.  The developments include the Founder/CEO departing and Overstock moving its blockchain assets into a vehicle that’s managed by a professional VC.   The most prominent of these blockchain investments – tZERO Group – is a blockchain based exchange that is regulated by the SEC and FINRA.  It received a strategic investment from Intercontinental Exchange (ICE, who run the New York Stock Exchange) earlier this year, which saw David Goone (a long-time ICE executive) become tZERO’s CEO.


Commodities: 1.5% NAV
No changes.  
OM is tentatively interested in increasing the size of this bucket, especially if recession fears increase and prices become more attractive.  After a decade of underinvestment there are supply/demand imbalances across many commodities, which are a core component of electric vehicles and the buildout of renewable energy.  However, OM is cognizant of the strong correlation of this bucket with a number of others in the portfolio (e.g. Uranium!), especially when markets are stressed or recession fears increase.


Shorts/Hedges: 5.7% NAV
Marginal change; added to OM’s position in PFIX
OM expects that future interest rates over the next 5-7 years will be higher than historical ones over the last 5-7 years.  For simplicity, PFIX invests ~50% of its capital into a US Treasury Bond (5-year) and uses the balance to purchase put options at 4.25% on the 20-year rate, expiring in May 2028.  In essence, with the value of the Treasury Bond providing a floor for PFIX should OM be wrong, the option provides substantial upside should medium term rates move beyond 4.25%.


Cash: 16.8% NAV
As a result of the portfolio changes, especially the liquidation of the Funds and reduction in Shipping/Tankers, OM is holding substantially more cash.  This cash level reflects OM’s view of the uncertainty in the economy and markets but expect OM to slowly start to invest it as either this fades or prices become more attractive.


Disclaimer:  Nothing above represents a recommendation in any way, shape or form so please don’t even think of trying to take it that way.  For added clarity, while Our Man is invested in all of the securities mentioned that’s a terrible reason for anyone else to do so.  Our Man also holds some cash and a few other securities (of negligible value).  You should not buy any of these securities because Our Man has mentioned them, but should do your own work and decide what’s best for you given your own circumstances/risk tolerance/etc. 

Monday, July 25

2022: Second Quarter Update

Portfolio Update
- Uranium:  OM made a small tweak to his Uranium exposure, slightly reducing the broader exposure to Uranium Miners (URNM) and replacing it with NuScale Power Corp (SMR).  Nuscale is a leading designer of small modular nuclear reactors.

Performance and Review
After an exceptional five+ months to start 2022, OM’s portfolio came rudely back to earth during the final three weeks of June.  OM’s portfolio fell by -19.4% during the quarter, but three-quarters of that loss came in the final three weeks of June.   This resulted in the portfolio under performing both the S&P 500 Total Return (-16.1%) and MSCI World (-14.4%) for the quarter.  The strong start to the year, means that OM’s portfolio (-15.8%) is still ahead of those equity indices year-to-date - S&P 500 TR (-20.0%) and MSCI World (-18.5%)

Second Quarter Attribution
 

Before we look at the myriad of ways OM managed to lose money in Q2, let’s briefly touch on what bucked the trend.  Unsurprisingly, the ‘short/hedge’ position in PFIX (+35 bps) – a play on higher medium term interest rates - was profitable as the Fed finally began raising rates and investors began to consider whether inflation was cyclical or structural.  The more that inflation proves to be structural, the more likely we see higher medium-term rates.   Elsewhere, OM profited from two Energy-adjacent positions - Shipping/Tankers (+274 bps) and the holding in TPL.   Shipping/Tankers were a beneficiary of the Ukrainian crisis and the subsequent impact of the transport of crude oil and petroleum products.   At the simplest level, Russian crude is going to India/China rather than Europe and Middle Eastern crude is going to Europe – inefficient trade routes resulting in greater ton-miles and demand for tankers.  Finally, OM’s exposure to Carbon Credits (+12bps) gained despite all the issues around high energy and electricity prices.  OMs exposure is primarily to the EU and California carbon credit markets where Green/ESG policies are a shibboleth, and the least likely to be abandoned even in times of stress.

The losses were broadly driven by some combination of three things:
i.    Stocks were down.
ii.    That was a choice; short-term pain for (expected) long-term gain.
iii.    That was foolish.

Unsurprisingly, with global markets heavily falling most of Our Man’s stocks headed in the same direction; Tech/4th Industrial Revolution (-59bps), Biotech (-64bps), Funds (-156bps) and the position in JOE (together with TPL, forming Idiosyncratic -107bps).  Within this group, the longer duration names (Tech/Biotech) and housing-related (JOE) fell more heavily reflecting the weakness of these sectors of the market, while some of the Funds held up slightly better.

The two other large risks that OM has chosen to take are commodity risk and short US dollar risk.  The two are of course related, with commodity positions containing an implicit short-dollar relative position.  With the US dollar continuing to strengthen during the quarter it was a headwind for OM’s non-US exposure; Brazil (-10bps), Vietnam (-76bps), India (-72bps), Greece (-59bps) and the Cambria Global Value ETF (GVAL, within Funds) all lagged.  The first half of the year largely saw commodities rise, despite the dollar increasing.  That changed abruptly in early June after the market moved from focusing on inflation to fearing recession, and its potential negative impact on commodity demand.  The result was a sharp pullback across the commodity complex, and an even larger one in commodity related equities.  OM’s positions in Uranium (-837bps), Tin (-311bps) and Commodities/Mining (-17bps) were hurt by this move.  While both Uranium and Tin pulled back the long-term fundamentals of both continue to look good and the volatility comes with the space.  With OM’s limited ability to trade the portfolio, position sizing is key - these large quarterly losses were within OM’s risk tolerance for the positions.  

The case for nuclear continues to develop as the challenges of energy transition from fossil fuels, and the far longer timeline it will require, become clearer to even politicians.  The West is thinking about building new reactors (led by the UK), postponing closures (California) and restarting (Japan) existing ones, as well as considering the security of its uranium supply (e.g. US establishing Strategic Uranium Reserve).  These have had an impact on pricing higher up the nuclear fuel chain (SWU prices) as well as long-term contracting prices which are up 50% from last year.

OM believes the case for Tin is even cleaner, with the small changes since OM's last major update all further enhancing the case.  As the rest of the market begins to run out of supply, Alphamin Resources (AFMJF) has progressed in 2022 from not only being the lowest cost producer to also being the one with the largest & most attractive undeveloped resource.  The company suffered in Q2 after considering its strategic options but not finding a deal to its liking, coupled with a substantial fall in the price of tin.   OM was delighted (and took the opportunity to add some in Q3) – the company is debt free and profitable at today’s tin prices, meaning it can fund its development internally.  It is by some distance the premier asset in the most strategic metal.  If the West has learned anything from the Russia/Ukraine crisis then the large Western mining companies should be potential acquirers, though probability suggest that it will eventually be bought by the Chinese.   Hopefully, that day is still a year or two away allowing more of the value to accrete to existing shareholders rather than the eventual acquirer.

Finally, OM managed to throw away a bunch of performance; the crypto positions in GBTC and ETHE cost the majority of the Blockchain’s (-495bps) loss.  Why throw away?  Well, when OM talked about the position last he made clear the aim was to reduce the size and eventually exit during 2021.  Sadly, having a plan is great but failing to execute is not – had he heeded his own advice and exited at the end of 2021, the portfolio would have saved ~500bps.  There’s no great excuse (but lots of poor ones) for why he did not – hence that was (at best) foolish!   The size of the drops in GBTC/ETHE were so large and dramatic that OM is being judicious about when to exit them, especially given their small size.  However, unlike previously – the position will definitely be sold by 2022-end if not well well before.  While the crypto positions would still be healthily profitable (500bps+) even if the existing GBTC/ETHE holdings went to zero, this is not a private equity portfolio; the sting of 2022’s profit foolishly thrown away, far outweighs the 25%+ IRR even in that worst case scenario.

Portfolio (as at 06/30/22 - all delta and leverage adjusted, as appropriate)
Dislocations: 43.6%
23.5% - Uranium (URNM, CCJ, NXE, PALAF, DNN, BNNLF, URG and SMR)
16.0% - Shipping/Tankers (STNG, INSW, EURN, TNK and DHT)
4.0% - Greece (GREK & ALBKY)

Thematic: 34.9%
7.3% - Tin (AFMJF, MLXEF and SBWFF)
6.8% - India (IBN, INDA and SMIN)
5.3% - Biotech: 4th Industrial Revolution (IBB & XLB)
4.1% - Blockchain/Crypto (GBTC, ETHE, and OSTK)
3.2% - Tech: 4th Industrial Revolution (JD & WCLD)
3.1% - Vietnam (VNM)
2.7% - Carbon Credits (KRBN)
1.9% - Commodities/Mining (FLMMF)
0.4% - Brazil (EWZ)

Technical: 0.0%

Idiosyncratic: 16.3%
11.1% - Funds (ARTTX, CWS, GVAL, and CAPE)
5.2% - Equities (TPL & JOE)

Shorts/Hedges: 3.7%
3.7% - Higher Medium-Term Rates (PFIX)

Cash: 1.5%

Disclaimer:  Nothing above represents a recommendation in any way, shape or form so please don’t even think of trying to take it that way.  For added clarity, while Our Man is invested in all of the securities mentioned that’s a terrible reason for anyone else to do so.  Our Man also holds some cash and a few other securities (of negligible value).  You should not buy any of these securities because Our Man has mentioned them, but should do your own work and decide what’s best for you given your own circumstances/risk tolerance/etc.  


Tuesday, January 25

2021: Fourth Quarter Update

Portfolio Update  

- India:  OM added to the portfolio’s India exposure through bother larger caps (INDA) and smaller/mid caps (SMIN).  OM also added a position in ICICI Bank (IBN).

 - Biotech: While the overall market has been strong, the biotech market has been exceptionally weak.  Our Man took the opportunity to increase his initial starter position through the sector ETFs (both IBB and XBI).  [Editor’s Note: Yup, OM was too early to do this!]

 - Tin: The tin thesis represents OM’s single highest conviction thesis entering 2022, but its size remains constrained by the paucity of ways to express it.   However, OM continued to add to his position in Alphamin Resources (AFMJF).  Alphamin’s Bisie Tin Project is undeniably the single best tin asset on the planet, with ever increasing signs that the deposit is somewhat larger than believed.

Performance and Review 

While OM’s portfolio ended up broadly flat during the fourth quarter, this disguises the sharp swing in performance – by November 9th, OM’s portfolio was up just over 18% for the quarter (and 60%+ for 2022) before giving back all of this performance over the remainder of the quarter. 

OM’s portfolio ended the quarter rising +0.1%, and trailed both the S&P 500 Total Return (+11.0%) and the MSCI World (Net, +8.1%) after losing money during December’s rally.  This meant that OM’s portfolio ended 2021 up +38.1%, though this still outpaced the S&P 500 TR (+28.7%) and the MSCI World (Net, +24.1%).


Fourth Quarter Attribution

OM’s Shipping-Tanker positions (-219bps) were the largest detractor with fears over Omicron’s impact on demand hanging over the names.  This wasn’t the only cause of weak performance as headline rates were already largely disappointing during the seasonally strong 4th quarter.  However, there is a bifurcated market with modern vessels receiving vastly superior rates to more inefficient older vessels.   These discrepancies and the strong steel price meant we finally saw an uptick in the scrapping of older vessels, which is an important factor in balancing the market. 

The largest contributor to performance was OM’s exposure to Tin (+244bps); the metal was one of the best performing commodities in 2021, setting numerous record highs towards year-end.  OM’s stocks couldn’t keep up with the metal price though Alphamin generated substantial profits, now has no net debt and continues to see positive drilling result.  Elsewhere, little has changed with OM’s thesis during 2021 other than further evidence that demand remains strong and key producers are either running out of reserves (Myanmar, 17% of production but only a couple of years of reserves left) or are seeing shifts to more expensive types of mining (Indonesia, the largest tin producer).  

While Uranium (-41bps) was not the biggest detractor during the quarter, it saw the largest intra-quarter swing having been up almost 800bps at one point.  As mentioned last quarter, Sprott completed its transaction for the renamed Sprott Physical Uranium Trust (“SPUT”) and was an aggressive purchaser of Uranium in September and throughout the 4th Quarter.  This saw the Uranium equities rally significantly during the first half of the quarter, before falling back through a mixture of getting ahead of themselves and concerns over the Omicron variant.  Fundamentally, things remain positive with nuclear included in the initial draft of the EU Taxonomy, China indicating it plans to build another 150 nuclear plants over 15-years (i.e. more than the rest of world has in 35-years), and wide scale Western government support for Advanced SMR (small modular reactors).  Though Uranium is OM’s largest position, unlike earlier in the year, it is sized such that OM can stomach the volatility in the space.   OM’s Blockchain holdings (-15bps) also saw significant volatility over the course of the quarter, as both Bitcoin and Ethereum slumped after touching record highs. 

OM’s exposure to the ‘new’ economy was a detractor during the 4th quarter with both the software positions in Tech-4th Industrial Revolution (-38bps) and the Biotech (-55bps) positions hurting.   Software remains an attractive sector in the long-term, and its evangelists speak many truths but it just remains very expensive [Editor’s Note:  Still true, despite the fall so far in January] and thus undersized in the portfolio.   OM’s Energy exposure (-67bps) was a detractor during the quarter. 

The exposure to Funds (+102bps) was positive, as they participated in the market’s rise.  The idiosyncratic exposure (+73bps) was entirely driven by the position in JOE, which continues to successfully develop parcels of real estate in the Florida Panhandle.   Our Man’s broad international exposure in Vietnam (+30bps), India (+2bps), Greece (-5bps) and Brazil (-2bps) was largelyy flat.  Brazil, while the smallest position, is the one where OM is currently spending the most time!  The last two-years have been a terrible time with the impacts of COVID, the Bolsonaro presidency, slowing economic growth, high inflation and interest rates rising (seven consecutive times from 2% to almost 10% during 2021!).  However, this is what makes it an interesting potential dislocation.  We know all of these things but Brazil remains rich in commodities, we are near the end of the rate rising cycle, have an election later in the year, and the equity market is cheap (~8x).

Portfolio (as at 12/31/21 - all delta and leverage adjusted, as appropriate) 

Dislocations: 40.1% 
24.9% - Uranium (URNM, CCJ, NXE, PALAF, DNN, BNNLF and URG) 
8.5% - Shipping/Tankers (STNG, INSW, EURN, TNK and DHT) 
4.0% - Greece (GREK & ALBKY) 
2.7% - Energy (SD)

Thematic: 30.7% 
9.2% - Blockchain/Crypto (GBTC, ETHE, and OSTK) 
8.3% - Tin (AFMJF, MLXEF and SBWFF) 
6.9% - India (IBN, INDA and SMIN) 
6.2% - Biotech: 4th Industrial Revolution (IBB & XLB) 
4.2% - Tech: 4th Industrial Revolution (JD & WCLD) 
3.8% - Vietnam (VNM) 
0.3% - Brazil (EWZ)
 
Technical: 0.0%
 
Idiosyncratic: 15.8% 
12.0% - Funds (ARTTX, CWS, GVAL, and CAPE) 
5.0% - Equities (TPL & JOE)
 
Shorts/Hedges: 0.0%
 
Cash: 3.8%  
 
Disclaimer:  Nothing above represents a recommendation in any way, shape or form so please don’t even think of trying to take it that way.  For added clarity, while Our Man is invested in all of the securities mentioned that’s a terrible reason for anyone else to do so.  Our Man also holds some cash and a few other securities (of negligible value).  You should not buy any of these securities because Our Man has mentioned them, but should do your own work and decide what’s best for you given your own circumstances/risk tolerance/etc.  


Wednesday, May 5

The Adventures of Tin(tin)

The largest core theme across OM’s portfolio is things where supply is limited and where there is increasing demand.  Most obviously, you’re probably sick of hearing OM harp on about the supply deficit in Uranium, while new nuclear power plants are being built in the developing world and existing ones having their lives extended in the developed world.  However, it’s more pervasive than just Uranium – you see it in Shipping/Tanker (record low order books coupled with increasing tonne miles), or in some equities (TPL/JOE own specific plots of land, i.e. supply is fixed and they are seeing increased demand for its use), or even Bitcoin (slowing rate of supply, coupled with increased demand from investors/institutions), etc.
 
COVID-19 has brought many of these situations to the fore as demand is recovering far more quickly than supply can adjust.  This is particularly the case in commodity-related sectors, especially where there have been years (or decades) of under-investment that have led to structurally under supplied markets.  Unsurprisingly, OM has focused his attention on the markets where long-term demand growth is combined with a structural supply issue.  
 
The tin market is one of the clearest examples of this.  Tin is the smallest of the base metals markets and is used across a wide variety of products (i.e. the opposite of uranium, which has one use) and thus typically ignored by investors.  Tin is often also used in tiny quantities in products – there are a couple of grams of tin costing <15c in your iPhone – but typically has no substitutes thus demand is very price inelastic.  Tin also has a crazy history on the supply side with failed CIA stockpiling and a collapsed cartel resulting in oversupply for almost 45-years.  All of the major suppliers are seeing substantial declines in their output, with most of the efficient and cheap to access tin having already been mined.  Finally, though Western investors have limited ways to participate in the tin market, one is the producer with the best global tin deposit!
 
Demand for Tin 
The potential long-term demand growth is the easy part of the equation for Tin. Tin’s primary usage is in solder, especially as the ‘glue’ for semiconductors.  Tin is also used in chemicals (as a stabilizer in plastics), tin plate (tin cans), float glass (i.e. your windows, as tin is vital to the Pilkington process) and in batteries (for EVs), but typically makes up a small but vital component of the overall systems in which it is used.  For example, a ‘tin can’ contains only 1-2% tin or an iPhone contains a couple of grams of tin yet it’s vital for the electronics and touch screen to work.  This means demand for tin is largely price insensitive.
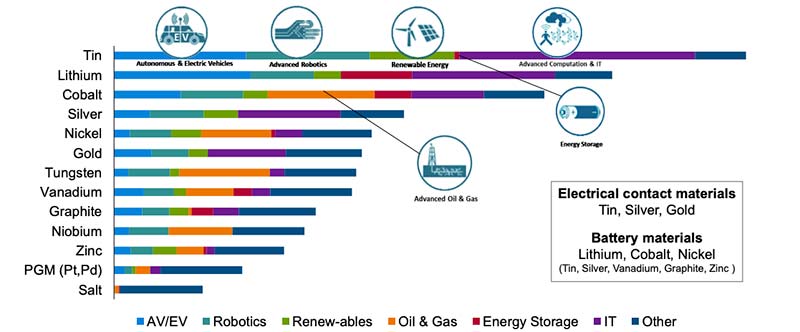
Tin’s primary use is for solder, especially in semiconductors where the electronic solder (which is 95% tin) joins the components.  Over the last 15-yrs, despite the growth in electronics the demand for solder was constrained by miniaturization, i.e. the semiconductors in your phone became ever smaller requiring less solder.  However, expected demand growth from the increased semiconductor content within electronics (phones, cars, etc.), as well as the growth in electronic technologies (think 5G and the “Internet of Things” or “4th Industrial Revolution”) is an order of magnitude higher than the loss from miniaturization.  Tin is also vital to to new technologies, such as battery technology, robotic and electric vehicles, which was highlighted in an MIT study of key new technologies and the metals required.


Supply 
Tin has been recognized as a strategic metal since it was first combined with copper to create bronze leading to the whole Bronze Age period!  This strategic importance, combined with being the smallest of the metal markets (~300,000 tonnes annual production) has resulted in a crazy history!
 
After WWII, the CIA identified tin as a strategic metal that was required for artillery and naval guns, and early electronics, and which the Soviet Union was entirely reliant upon imports.   This led to the US Defense and Logistics Agency (“DLA”) aggressively procuring tin until 1960, such that in thirteen years it had acquired over 350,000 tonnes of tin, or three-years of global annual production at the time!  The DLA eventually gave up as its purchases had squeezed supply, causing price to rise and pushing the Soviets into major exploration, production and eventual self-sufficiency.  The DLA subsequently liquidated this tin inventory and it took them until 2006 to do so.  This huge forty-five year (!!!) secondary supply overhang limited the need for new tin exploration and production during this period.  
 
While this was all happening the International Tin Council was created in the late 1950s.  Over the course of twenty-five years, six separate International Tin Agreements were signed by thirty countries to limit production.  While a key aim was to reduce fluctuations in the tin price, the majority of the members were producers and so the agreements contained increases in the targeted tin price.  However, by 1985 the ITC ran into soft demand (damn aluminium cans!) and new tin discoveries in non-member countries (primarily Indonesia and Peru).  This coupled with quota busting by ITC members led to a vastly oversupplied market and the ITC collapsed into bankruptcy in 1985.  In its attempts to hold the tin price up, the ITC had run up liabilities of just under $1.5 billion (in 1985 dollars!!!) and held over 120,000 tonnes (or eight month’s global supply) of physical tin, as well as additional derivative purchases.
 
During the 1990s and 2000s while the DLA and ITC were slowly liquidating their tin inventory and China and Indonesia were ramping up their tin production the market was in surplus.  This meant that the tin price was depressed and there was no incentive for producers to look for tin.  After the secondary liquidations finally finished in the mid-2000s, the tin price rose only for Myanmar to plug the under-investment gap after ramping up production in the 2010s.  China and Indonesia are the two largest producers in the market today, each representing 25% of supply, though production is down significantly from its highs.  Myanmar represents 17% of global tin production and will have run out of tin in 2023!!  
 
Finally, there’s a wrinkle in the way that tin is mined.  The cheapest and most efficient way of mining  tin is alluvial mining, where a river or stream bed is mined for deposits.  This can be done artisanally in a similar way to gold pan-handlers and on a more commercial basis through dredging.  However, the best alluvial mining sites (e.g. Myanmar, Malaysia, and Indonesia) have all seen significant production declines as they have mined most of their resource.  This means future tin production will come from underground (hard rock) mining, which is more expensive, difficult and capital intensive and requires a significantly higher tin price.
 
In summary, you have a potential perfect storm for a non-linear rise in the tin price.   On the supply side you have a market where massive secondary supply has limited exploration over the last 50+ years, existing suppliers are running out of material, and where the only viable method of mining is vastly more expensive and less efficient.  At the same time, you have a material that is a tiny but key and not substitutable component of almost its entire end demand, and where technological changes are driving material demand growth in the coming years.
 
How is OM expressing it? 
For Western investors there are currently only 2 investable producers; Alphamin Resources (AFMJF) and Metal X Limted (MLXEF).  The difference between the two companies is stark!  
 
The majority of OM’s exposure is to Alphamin Resources (AFMJF) who own ~80% of the Bisie tin mine in the Democratic Republic of Congo (“DRC”).  Bisie is THE premier tin asset globally.  It has the highest grade resource of major mines globally, is a lowest quartile producer, and currently produces about 4% of global supply (it is 8% of global reserves), with near term ability to expand production. 


Alphamin is significantly cash generative at today's tin prices and is using its free cash flow to pay off its external debt (OM’s back of the envelope model suggests it’ll be debt free before year-end) and then potentially pay a dividend.   The company has benefited from upgrading management at both the corporate and mine levels, and at today's tin prices will be generating close to  a fifth of its current market cap in free cash flow this year.  However, the single mine and DRC-related risks limit OM’s position size, though it should be noted that the DRC Government has a 5% stake in the mine.
 
Metal X (MLXEF) is Australia’s largest tin miner but is a marginal producer that expects to mine 10K tonnes of tin by 2025 and can barely make money even at today’s rising tin price.  It is thus riskier and far more levered to a higher tin price, and as such a tiny position for OM. 


Disclaimer:  Nothing above represents a recommendation in any way, shape or form so please don’t even think of trying to take it that way.  For added clarity, while Our Man is invested in all of the securities mentioned that’s a terrible reason for anyone else to do so.