With Europe deciding what to do with Greece, and with the Fed about to try their latest unconventional policy to get the economy going (or at least the markets up), what better time to (largely) look away from finance and see what’s been in Our Man’s google reader recently! As usual, I’ve put the finance ones at the top and the non-finance (more interesting?) ones at the bottom.
- Short-termism and the risk of another financial crisis
An article penned by Sheila Bair as she left the chairmanship of the FDIC, where she appears to have been one of the few people, in power, who possessed any common sense and didn’t want to bail out the banks. Her “exit” interview is well worth a read too. (Sheila Bair, Washington Post)
- Is the SEC covering up Wall Street crimes?
It would be funny, if there hadn’t been a major economic meltdown and market crash that took place while (amongst many other things) the regulators were asleep at the wheel. While it’s not apparent to all, capitalism requires good strong regulation to avoid merely turning into cronyism. (Matt Taibbi, Rolling Stone)
- The Future of Light is LED
As you know, Our Man has a small exposure to Energy Efficiency which is currently focused on battery technology. However, one of the other areas that is interesting is LED technology; while LEDs have taken over in phones, computers and now TVs, the ultimate hope is that LED technology will be used in lightbulbs. Here’s a good primer on LEDs. (Dan Koeppel, Wired)
- Why Software is Eating the World
The initial leaps forward in technology were as the result of hardware (e.g. a PC you could use at home, a mobile phone, etc) but the real transformation has come from the impact of software. If you want think further on the subject, John Hempton’s (Bronte Capital) post is a great place to start. (Marc Andreesen, Wall Street Journal)
- Enter the Cyber-dragon
With software and computer technology becoming so important, it shouldn’t be a surprise that both corporate and national espionage (and warfare) is shifting to take place online. (Michael Joseph Gross, Vanity Fair)
- Getting Bin-Laden
A look behind Seal Team Six’s mission. (Nicholas Schmidle, New Yorker)
Apple Section:
- How Apple Works: Inside the world’s biggest startup
Apple has been one of the success stories of the 2000’s, with its entrepreneurial enterprise and innovation being rewarded on both Main Street and Wall Street. Here’s Fortune’s view of how the company works. (Adam Lashinsky, Fortune magazine)
- Creation Myth
It might never have been, but for the kindness (and foolishness) of others. How Xerox unwittingly (and perhaps incompetently) failed to realize what it had already created/invented, and gave Apple a glimpse of the future. “If Xerox had known what it had and had taken advantage of its real opportunities,” Jobs said, years later, “it could have been as big as I.B.M. plus Microsoft plus Xerox combined—and the largest high-technology company in the world.” (Malcolm Gladwell, New Yorker)
- Steve Jobs’ Commencement Address at Stanford (2005)
Wherein he touches on a number of stories that helped mould him as a person. (Steve Jobs, YouTube)
Tuesday, September 20


Monday, September 5
August Review
Portfolio Update
After Our Man’s recent comments on the lack of portfolio activity, it goes without saying that August proved to be one of the portfolio’s busiest months! The following changes were made during the course of the month, and are listed in chronological order:
- NCAV: The position in LAB (now under ticker COWN) was sold during the month, as a result of COWN’s takeover of LAB, which completed while Our Man was on vacation. Due to incompetence, Our Man didn’t sell the position before the takeover closed, and as the ticker symbol changed (as LAB became part of COWN), he was forced to wait before selling it.
- Currency: Our Man increased the Short position in the Euro (i.e. a bet on the US dollar strengthening versus the Euro) by around 1/3 in the early part of the month. While the Euro has remained resilient despite the sovereign debt concerns (centred on the PIIGS countries) and has been bolstered by countries (especially China) buying French and German bonds, Our Man is wagering that this resilience will not last. The price of this transaction was slightly above the August-end price, and as such this additional exposure cost a small amount of money in August.
- Value Equity: Our Man doubled the DRWI position during August, as the stock suffered heavily. This move was only possible due to the undersized nature of the position (it was c1% before being doubled) and the attractive entry price, especially given the company’s fundamentals were unchanged. While the entry price for this additional exposure was well above DRWI’s lows for the month, it was also below the month-end price and hence contributed positively.
- Bond Funds: When Our Man added DLTNX to the portfolio, back in January, he said it was a medium-term replacement for VBIIX. The sharp fall in US Treasury Bond yields, provided an opportunity to exit the VBIIX position at an attractive price (though well-below the highs of the month).
- Put/Hedges: The start of August was exceptionally volatile, and as a result Our Man’s index puts (on SPY and IWM) saw both their implied volatility increase and their delta. Given the speed of the move, in the middle of the month, Our Man despite suspecting the market was headed much lower was worried about the possibility of a short-term (1-3month) sharp rally in the markets and so sought to hedge this (and the likely resultant fall in medium-term volatility) out. He did so through taking a position in XIV, which is a complicated instrument that seeks to perform the opposite of short-term futures on the CBOE Options Volatility Index, or VIX. In essence, it is profitable when markets start calming down (i.e. being less volatile) AND people expect them to remain at these calmer (less volatile) levels. As you know, August did not calm down (and we certainly seem to have no expectations of reduced volatility) and thus the position suffered heavily (20-25%) in the second half of the month. The only good news was that its size was limited (to an initial 2% NAV), and it remains to be seen/is up for debate whether Our Man was merely early or foolishly crossed one of his own risk tenets (see number 6).
- Treasury Bonds: The volatility in the market resulted in a large move towards “safe” assets during August. Despite all the naysayers, and an S&P downgrade, US Treasury bonds proved to be both a safe asset and largely under-owned, resulting in a large fall in Treasury Yields (and rise in price of Treasury bonds!). With Treasury Bonds representing the largest part of the portfolio, Our Man took advantage of this to sell his Aug-29 US Treasury bond (at a 2.87% yield to maturity). While Our Man still thinks yields, especially at the long-end of the curve (i.e. the furthest into the future, such as bonds maturing in 20-30yrs time) may continue to fall, the risk-reward is less attractive at this point.
Performance Review
As regular readers will know, Our Man has not been a buyer of the recent market rally and isn’t much of a fan of QE2, and thus his portfolio has had a slight bearish tilt to it. This tilt was fully visible during August, with the portfolio up +4.2% for the month (YTD: +4.1%). Despite the positive performance, the portfolio was not immune from the market’s volatility and saw its 2 best days (+1.5% on 8/4 and 8/8) and its worst day (-1.4% on 8/11) since inception.
Unsurprisingly, August’s performance was driven entirely by the Treasury Bond book (+436bps) and the Bond Funds (+45bps), which both benefited from the large decline in US Treasury Bond yields.
The Equity books, on the other hand proved to be a mixed bag. Other Equities (+12bps) performed admirably, despite the market, while the NCAV book (-24bps) underperformed, hampered by its micro-cap makeup and falling over 8%. The Puts/Hedges book (-6bps) was disappointingly down for the month, though this was entirely the result of a c40bp negative contribution of the XIV investment. The Value Equities book (-42bps) was also negative for the month; DRWI’s performance (+1bp) was helped by the additional investment in mid-month while THRX (-42bps) was not so fortunate.
The Short China book (+6bps) benefited slightly during the month, though with uncertainty over a global slowdown yet to fully spread to copper prices it struggled to contribute significantly. The Energy Thesis book (-5bps) and Currencies book (-5bps) were small negative contributors.
With the adjustments to the portfolio, the make-up is somewhat changed compared to recent months. While the most noticeable difference is the increase in cash, the portfolio retains a smaller bearish tilt and should not suffer heavily in a market rally. This reflects Our Man’s concern that the FED, much like the drunken gambler who keeps losing, will not view the economic uncertainty/weakness as reflection of their abject failure with QE2 but as a sign that they did not bet big enough in QE2. If circumstances (in Europe) do not overwhelm them first, Our Man expects to hear more and more about QE3 (most likely under another guise, Operation Twist, or the like) as the coming weeks progress, and the market to rally on expectations of its announcement. Expect Our Man to further add to the puts/hedge book should this come to pass…
Portfolio (as at 8/31 - all delta and leverage adjusted, as appropriate)
25.4% - Treasury Bonds (TLT, and 158bps premium in TBT Jan-13 puts)
15.2% - Bond Funds (DLTNX and HSTRX)
5.2% - Value Idea Equities (THRX, and DRWI)
2.4% - Other Equities (NWS, CMTL and SOAP)
2.2% - NCAV Equities
0.3% - Energy Efficiency (AXPW)
-0.6% - China-Related Thesis (15bps premium in FCX put)
-4.2% - Hedges/Put Options (34bps premium in S&P Dec-11 puts, 37bps in IWM Jan-12 puts, and 15bps SLV Jan-12 puts, all offset by a position in XIV)
-8.5% - Currencies (EUO – Short Euro)
49.2% - Cash
Disclaimer: For added clarity, Our Man is invested in all of the securities mentioned (TLT, TBT puts, DLTNX, HSTRX, THRX, DRWI, NWS, CMTL, SOAP, AXPW, FCX puts, SPY puts, IWM puts, SLV puts, XIV and EUO). He also holds some cash.
After Our Man’s recent comments on the lack of portfolio activity, it goes without saying that August proved to be one of the portfolio’s busiest months! The following changes were made during the course of the month, and are listed in chronological order:
- NCAV: The position in LAB (now under ticker COWN) was sold during the month, as a result of COWN’s takeover of LAB, which completed while Our Man was on vacation. Due to incompetence, Our Man didn’t sell the position before the takeover closed, and as the ticker symbol changed (as LAB became part of COWN), he was forced to wait before selling it.
- Currency: Our Man increased the Short position in the Euro (i.e. a bet on the US dollar strengthening versus the Euro) by around 1/3 in the early part of the month. While the Euro has remained resilient despite the sovereign debt concerns (centred on the PIIGS countries) and has been bolstered by countries (especially China) buying French and German bonds, Our Man is wagering that this resilience will not last. The price of this transaction was slightly above the August-end price, and as such this additional exposure cost a small amount of money in August.
- Value Equity: Our Man doubled the DRWI position during August, as the stock suffered heavily. This move was only possible due to the undersized nature of the position (it was c1% before being doubled) and the attractive entry price, especially given the company’s fundamentals were unchanged. While the entry price for this additional exposure was well above DRWI’s lows for the month, it was also below the month-end price and hence contributed positively.
- Bond Funds: When Our Man added DLTNX to the portfolio, back in January, he said it was a medium-term replacement for VBIIX. The sharp fall in US Treasury Bond yields, provided an opportunity to exit the VBIIX position at an attractive price (though well-below the highs of the month).
- Put/Hedges: The start of August was exceptionally volatile, and as a result Our Man’s index puts (on SPY and IWM) saw both their implied volatility increase and their delta. Given the speed of the move, in the middle of the month, Our Man despite suspecting the market was headed much lower was worried about the possibility of a short-term (1-3month) sharp rally in the markets and so sought to hedge this (and the likely resultant fall in medium-term volatility) out. He did so through taking a position in XIV, which is a complicated instrument that seeks to perform the opposite of short-term futures on the CBOE Options Volatility Index, or VIX. In essence, it is profitable when markets start calming down (i.e. being less volatile) AND people expect them to remain at these calmer (less volatile) levels. As you know, August did not calm down (and we certainly seem to have no expectations of reduced volatility) and thus the position suffered heavily (20-25%) in the second half of the month. The only good news was that its size was limited (to an initial 2% NAV), and it remains to be seen/is up for debate whether Our Man was merely early or foolishly crossed one of his own risk tenets (see number 6).
- Treasury Bonds: The volatility in the market resulted in a large move towards “safe” assets during August. Despite all the naysayers, and an S&P downgrade, US Treasury bonds proved to be both a safe asset and largely under-owned, resulting in a large fall in Treasury Yields (and rise in price of Treasury bonds!). With Treasury Bonds representing the largest part of the portfolio, Our Man took advantage of this to sell his Aug-29 US Treasury bond (at a 2.87% yield to maturity). While Our Man still thinks yields, especially at the long-end of the curve (i.e. the furthest into the future, such as bonds maturing in 20-30yrs time) may continue to fall, the risk-reward is less attractive at this point.
Performance Review
As regular readers will know, Our Man has not been a buyer of the recent market rally and isn’t much of a fan of QE2, and thus his portfolio has had a slight bearish tilt to it. This tilt was fully visible during August, with the portfolio up +4.2% for the month (YTD: +4.1%). Despite the positive performance, the portfolio was not immune from the market’s volatility and saw its 2 best days (+1.5% on 8/4 and 8/8) and its worst day (-1.4% on 8/11) since inception.
Unsurprisingly, August’s performance was driven entirely by the Treasury Bond book (+436bps) and the Bond Funds (+45bps), which both benefited from the large decline in US Treasury Bond yields.
The Equity books, on the other hand proved to be a mixed bag. Other Equities (+12bps) performed admirably, despite the market, while the NCAV book (-24bps) underperformed, hampered by its micro-cap makeup and falling over 8%. The Puts/Hedges book (-6bps) was disappointingly down for the month, though this was entirely the result of a c40bp negative contribution of the XIV investment. The Value Equities book (-42bps) was also negative for the month; DRWI’s performance (+1bp) was helped by the additional investment in mid-month while THRX (-42bps) was not so fortunate.
The Short China book (+6bps) benefited slightly during the month, though with uncertainty over a global slowdown yet to fully spread to copper prices it struggled to contribute significantly. The Energy Thesis book (-5bps) and Currencies book (-5bps) were small negative contributors.
With the adjustments to the portfolio, the make-up is somewhat changed compared to recent months. While the most noticeable difference is the increase in cash, the portfolio retains a smaller bearish tilt and should not suffer heavily in a market rally. This reflects Our Man’s concern that the FED, much like the drunken gambler who keeps losing, will not view the economic uncertainty/weakness as reflection of their abject failure with QE2 but as a sign that they did not bet big enough in QE2. If circumstances (in Europe) do not overwhelm them first, Our Man expects to hear more and more about QE3 (most likely under another guise, Operation Twist, or the like) as the coming weeks progress, and the market to rally on expectations of its announcement. Expect Our Man to further add to the puts/hedge book should this come to pass…
Portfolio (as at 8/31 - all delta and leverage adjusted, as appropriate)
25.4% - Treasury Bonds (TLT, and 158bps premium in TBT Jan-13 puts)
15.2% - Bond Funds (DLTNX and HSTRX)
5.2% - Value Idea Equities (THRX, and DRWI)
2.4% - Other Equities (NWS, CMTL and SOAP)
2.2% - NCAV Equities
0.3% - Energy Efficiency (AXPW)
-0.6% - China-Related Thesis (15bps premium in FCX put)
-4.2% - Hedges/Put Options (34bps premium in S&P Dec-11 puts, 37bps in IWM Jan-12 puts, and 15bps SLV Jan-12 puts, all offset by a position in XIV)
-8.5% - Currencies (EUO – Short Euro)
49.2% - Cash
Disclaimer: For added clarity, Our Man is invested in all of the securities mentioned (TLT, TBT puts, DLTNX, HSTRX, THRX, DRWI, NWS, CMTL, SOAP, AXPW, FCX puts, SPY puts, IWM puts, SLV puts, XIV and EUO). He also holds some cash.
Thursday, August 11
Chartology: U-G-L-Y, You ain’t got no alibi!
As some of you may have noticed, despite the attempted rallies, the markets have not been a pretty sight this month! No doubt, if you’ve had the misfortune of watching the terrible talking heads you’ve no doubt heard it’s all the politicians fault (debt-ceiling muppetry), or S&P’s (how dare they downgrade the US from AAA), or the Europeans (call that a plan for dealing with Greece, Ireland and Portugal and Spain and err Italy), or companies (how dare they say things aren’t as rosy as the talking heads would like) or just the whole world (damn the whole globe for a global slow-down!). As you know, Our Man believes that markets are far more of a Bak-Tang-Wisenfeld sandpile and when they’re in a “critical state” it only takes one stray grain of sand landing in the wrong spot to bring it all down; thus, there’s little point blaming the particular grain of sand whether it’s European, Global, political, economic or company fundamentals!
Given that, here’s some graphs showing you why (or perhaps, that) we’re in a critical state!
1) Valuation

Look, the CAPE (or Shiller PE10) isn’t perfect and certainly isn’t useful as a timing device but it does provide the single best (and historically tested) look at valuation on a long-term basis. Forget what you hear about markets being cheap (especially when it’s drivel like based on analyst-projected operating earnings) and suck it up…equity markets have been expensive by historical standards for well over a decade! If CAPE isn’t your long-term valuation measure of choice, how about Tobin’s Q or Market Cap-to-GDP (Buffet's favourite, apparently).
2) Corporate Fundamentals

(Graph courtesy of Bill Hester, Hussman Funds)
If you want to buy stocks that are not only expensive but whose profit margins are close to their all time highs, then that’s your prerogative. It’s certainly possible that margins improve and we see record highs, but is that really something you want to bet on.
3) Signs of Economic Slowdown

Sure, this is just a PMI graph for China and it’s barely crossed into the recessionary (<50) readings but pick a major economy, and this and the leading indicators all look the same. So far that’s over-valued stocks, with near peak margins and signs of global economies cooling…doesn’t exactly sound like a recipe for success.
4) US Economic Data is pretty either

There’s no great way of telling how the economy is doing in real-time, but the Chicago Fed’s National Activity Index is a good start (I’d also point you in the direction of the Philly Fed’s ADS Index . You’ll notice that they’re not telling a happy tale at the moment with both so far above, but flirting with, recession-like levels (and noticeably worse than 2010’s dalliances).
5) Italian yields have seen better days

The ECB's buying of Italian and Spanish bonds this week has clearly helped lower their yields from the danger levels seen last week, but the risk is that it's coming at the cost of putting France into the firing line. With the Italian’s having 120% Debt-to-GDP, will France and Germany risk their AAA status (which is vital to the EFSF) to buy Italy time for reform and austerity? Perhaps, will it work out as well(!) as buying Greece time by bailing it out last year has? Probably, and that's what should worry you!
6) The Charts
 (Courtesy of OEW/Elliott Wave lives on)
Look, Our Man will never profess to be a technical analyst, or to fully appreciate its wares, but he does have a small crush on Objective Elliot Wave analysis, what with its relation to behavioural theory and market psychology and all. It’s not perfect but given OEW's track record, when it flips from a bull market to bear market (and vice versa) then Our Man thinks you should at least listen (especially since they’ve been suggesting the bull market might be ending since May, with increasing conviction through July).
In conclusion, these are the little things that make a market interesting. They have been on the brink of a “critical state” for a while now so blaming any one thing is foolish. Our Man didn’t own much equity before and he sure as hell won’t be using this correction to load-up, and instead will only be nibbling at the odd thing that becomes exceptionally cheap under the security blanket that his puts offer. What'd it take for OM to load-up? Well, a good starting point to thinking about having a reasonable equity position would be when valuations were cheap (i.e. CAPE under historical mean) and margins were small; and Our Man would "fill his boots" should he ever see a CAPE near its historical lows and margins near theirs (but we're talking an S&P of c400 for that to happen, so don't hold your breath). As for everyone else (in the whole wide world), they make their own decisions and that’s what makes a market!
Special Bonus Chart: That downgrade…
 It didn’t seem to cause any immediate spike in Japanese yields! Interestingly, US yields have also collapsed post-downgrade…not exactly what the talking heads had in mind! Apparently, inflation (and inflation expectations) & GDP growth (and growth expectations) have more impact on what bond investors do and where yields trade than an S&P rating. Colour me shocked!
Given that, here’s some graphs showing you why (or perhaps, that) we’re in a critical state!
1) Valuation

Look, the CAPE (or Shiller PE10) isn’t perfect and certainly isn’t useful as a timing device but it does provide the single best (and historically tested) look at valuation on a long-term basis. Forget what you hear about markets being cheap (especially when it’s drivel like based on analyst-projected operating earnings) and suck it up…equity markets have been expensive by historical standards for well over a decade! If CAPE isn’t your long-term valuation measure of choice, how about Tobin’s Q or Market Cap-to-GDP (Buffet's favourite, apparently).
2) Corporate Fundamentals
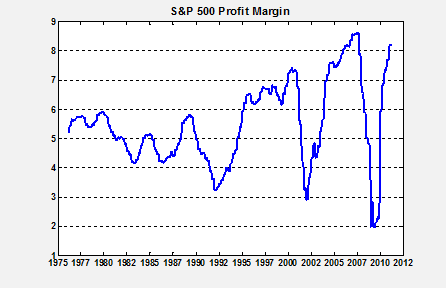
(Graph courtesy of Bill Hester, Hussman Funds)
If you want to buy stocks that are not only expensive but whose profit margins are close to their all time highs, then that’s your prerogative. It’s certainly possible that margins improve and we see record highs, but is that really something you want to bet on.
3) Signs of Economic Slowdown

Sure, this is just a PMI graph for China and it’s barely crossed into the recessionary (<50) readings but pick a major economy, and this and the leading indicators all look the same. So far that’s over-valued stocks, with near peak margins and signs of global economies cooling…doesn’t exactly sound like a recipe for success.
4) US Economic Data is pretty either
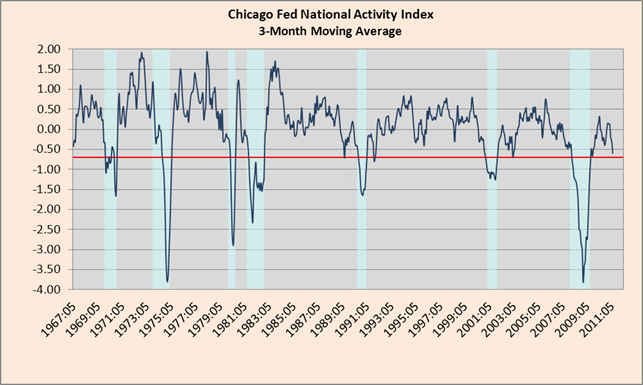
There’s no great way of telling how the economy is doing in real-time, but the Chicago Fed’s National Activity Index is a good start (I’d also point you in the direction of the Philly Fed’s ADS Index . You’ll notice that they’re not telling a happy tale at the moment with both so far above, but flirting with, recession-like levels (and noticeably worse than 2010’s dalliances).
5) Italian yields have seen better days

The ECB's buying of Italian and Spanish bonds this week has clearly helped lower their yields from the danger levels seen last week, but the risk is that it's coming at the cost of putting France into the firing line. With the Italian’s having 120% Debt-to-GDP, will France and Germany risk their AAA status (which is vital to the EFSF) to buy Italy time for reform and austerity? Perhaps, will it work out as well(!) as buying Greece time by bailing it out last year has? Probably, and that's what should worry you!
6) The Charts

Look, Our Man will never profess to be a technical analyst, or to fully appreciate its wares, but he does have a small crush on Objective Elliot Wave analysis, what with its relation to behavioural theory and market psychology and all. It’s not perfect but given OEW's track record, when it flips from a bull market to bear market (and vice versa) then Our Man thinks you should at least listen (especially since they’ve been suggesting the bull market might be ending since May, with increasing conviction through July).
In conclusion, these are the little things that make a market interesting. They have been on the brink of a “critical state” for a while now so blaming any one thing is foolish. Our Man didn’t own much equity before and he sure as hell won’t be using this correction to load-up, and instead will only be nibbling at the odd thing that becomes exceptionally cheap under the security blanket that his puts offer. What'd it take for OM to load-up? Well, a good starting point to thinking about having a reasonable equity position would be when valuations were cheap (i.e. CAPE under historical mean) and margins were small; and Our Man would "fill his boots" should he ever see a CAPE near its historical lows and margins near theirs (but we're talking an S&P of c400 for that to happen, so don't hold your breath). As for everyone else (in the whole wide world), they make their own decisions and that’s what makes a market!
Special Bonus Chart: That downgrade…

Wednesday, August 3
July Review
Portfolio Update
There were no changes to the portfolio during July.
Performance Review
After positive performance on each of the first 8 trading days of July had safely ensconced the book well into positive territory, the portfolio bounced around to ultimately end near the mid-point between its intra-month high and low. The result was a strong July, with the portfolio finishing +1.4% for the month bringing the year-to-date performance (-0.1%) to the brink of flat.
After positive performance on each of the first 8 trading days of July had safely ensconced the book well into positive territory, the portfolio bounced around to ultimately end near the mid-point between its intra-month high and low. The result was a strong July, with the portfolio finishing +1.4% for the month bringing the year-to-date performance (-0.1%) to the brink of flat.
With all the words spent discussing US default as the debt-ceiling debate intensified into month-end, it would be reasonable to think that the L Treasury Bonds book would have suffered. This thought would have been mistaken, as the book drove performance (+159bps) largely on the back of a seemingly continual stream of disappointing economic data. The Bond Funds book (+42bps) also contributed strongly.
The Equity books were somewhat disappointing. The NCAV book (+2bps), which has underperformed so far this year, largely weathered the storm while the limited size of the Short China (-1bp) and Energy Efficiency (-1bp) books meaning that they had no real impact on the portfolio. Disappointingly, both the Other Equities (-17bps) and the Put/Hedges (-13bps) books suffered more than might have been expected, with the Silver puts largely responsible for the latter’s performance. The Value Equity book (-37bps) was again the worst performing book, with both positions suffering from their longer-term thesis as risk aversion increased. While we remain in a risk-off period both THRX and DRWI are likely to continue their struggles in the coming months, with neither likely to have a major catalyst till late-2011/early-2012. Given their limited size in the portfolio, while the volatility makes for uncomfortable month-to-month performance, it is a risk that the portfolio can comfortably underwrite and there are likely to be opportunities to add to both names at attractive prices in the days and weeks ahead.
The portfolio’s Currency exposure (+4bps) was positive, despite the latest European bailout. My opinion is largely unchanged; today’s situation bears a certain analogue to the failure of Credit-Anstalt (in 1931) and the dominoes that subsequently toppled due to the poor handling of the issues of the day. I believe that we are continuing to witness the slow-motion toppling of dominoes, resulting from too much debt (i.e. debt beyond a level that can realistically expect to be repaid). It was started by the US subprime crisis but has now spread its epicenter to European sovereigns fanned by a global unwillingness to accept failure (especially of banks), to force bondholders to accept their investment risk (i.e. default), and a refusal to treat the source of the crisis (too much debt which means more debt is not the solution) rather than the symptoms (liquidity issues). Europe’s single currency experiment (removing the option of devaluation, for the weak) and its bureaucratic structure are amongst the reasons that the ricochet has bounced there first.
Portfolio (as at 6/30 - all delta and leverage adjusted, as appropriate)
36.9% - Treasury Bonds (Aug-29 Bond & TLT, and 76bps premium in TBT Jan-13 puts)
22.1% - Bond Funds (VBIIX, DLTNX and HSTRX)
5.0% - Value Idea Equities (THRX, and DRWI)
3.0% - NCAV Equities
2.4% - Other Equities (NWS, CMTL and SOAP)
36.9% - Treasury Bonds (Aug-29 Bond & TLT, and 76bps premium in TBT Jan-13 puts)
22.1% - Bond Funds (VBIIX, DLTNX and HSTRX)
5.0% - Value Idea Equities (THRX, and DRWI)
3.0% - NCAV Equities
2.4% - Other Equities (NWS, CMTL and SOAP)
0.3% - Energy Efficiency (AXPW)
<-0.1% - China-Related Thesis (6bps premium in FCX put)
-1.1% - Hedges/Put Options (14bps premium in S&P Dec-11 puts, 17bps in IWM Jan-12 puts, and 17bps SLV Jan-12 puts)
-6.7% - Currencies (EUO – Short Euro)
28.0% - Cash
<-0.1% - China-Related Thesis (6bps premium in FCX put)
-1.1% - Hedges/Put Options (14bps premium in S&P Dec-11 puts, 17bps in IWM Jan-12 puts, and 17bps SLV Jan-12 puts)
-6.7% - Currencies (EUO – Short Euro)
28.0% - Cash
Disclaimer: For added clarity, Our Man is invested in all of the securities mentioned (Aug-29 Treasury Bond, TLT, TBT puts, VBIIX, DLTNX, HSTRX, THRX, DRWI, NWS, CMTL, SOAP, AXPW, FCX puts, SPY puts, IWM puts, SLV puts and EUO). He also holds some cash.
Friday, July 29
The Lion Sleeps Tonight
- "Mbube", by Solomon Linda and the Evening Birds (the original)
 *
* As you may have noticed, there’s a bit of bother over the US debt ceiling, which if not increased is likely to lead to all kinds of uncertainty and seemingly anything ranging from a complete government shut-down, to downgrades of US debt, to default, and perhaps even to intergalactic warfare (okay, I might have made that last one up). Not only that but the same people who’re in-charge of coming up with the budget also set the debt ceiling (at a completely different time), which makes one wonder how they’re all “shocked” that the results of the budget they set 6months ago broke through the arbitrary debt limit they set 18months ago. Pretty much moronic all around, and the spectacle of recent weeks only adds to that.
Our Man was chatting with Mrs. OM this week, and the fact that not much has changed in the portfolio over recent weeks (a figurative lion sleeping?), despite the book’s largest position being in US Treasury bonds, came up. What better time (or possibly more foolish, depending on how things pan out) to share his thoughts with you. The short-answer is things are very uncertain and it depends on what happens, when and how: will the US actually full-on default, or prioritise payments/shut-down parts of the government (which I suspect is most likely), or will it merely miss/delay some interest payments and then see a compromise reached, etc). Clearly though, this isn’t much help in understanding how (or indeed, if) Our Man is thinking, so let’s break it down a little.
Equity books: Doing nothing here is relatively easy as the total Long Equity exposure across the equity-orientated books (NCAV, Value Equities, Other Equities & Energy Efficiency) is a mere 11.1% NAV. Thus even a substantial decline fails to produce a sizeable impact (>500bps) on performance. This is before we even consider the positive impact that fall in markets would have on the put/hedge book (51bps of premium at risk), and the manner in which this exposure (currently a mere 1.3% short) would increase as the markets fell. As such, it’s pretty clear that the equity book wouldn’t drive any major losses and that the worst possible result for it would be a market fall of ‘only’ 10-30%.
Fixed Income books (L Treasury Bonds and L Bond Funds, c58.5% NAV): In the short-run, I’d expect these to suffer should the US miss interest payments (remember new debt can be issued to meet principal payments, as the total level of debt doesn’t change) but am comfortable underwriting these short-term losses in the portfolio in all but the most extreme of scenarios (the US government saying we’ll never payback any bonds ever) and thus am comfortable with the existing position sizes. The longer-term is harder to predict, and while some expect that it’s just a continuation in the US’ path to hyperinflation, I (unsurprisingly) suspect that it won’t. More likely, any prolonged cut-back in government services will help threaten to push the US into negative GDP growth territory (after <2% GDP in Q1, and I dare say something similar or worse in Q2) and make deflation the more likely scenario. If there is eventually a debt-ceiling deal (involving cutting government spending) that sees creditors made whole (for the delayed interest payments), I believe this would be good for Treasuries! In the case of no default but a downgrade of US debt (from AAA to AA) then I’d be a buyer of US 10-Yr Treasuries on any noticeably widening of yields (i.e. the 10-Yr moving from c2.90% to 3.25-3.50%), since the headline rating is irrelevant (as seen in Japan) when compared to factors like inflation.
As an aside, when thinking about defaulting/etc there’s a subtle difference between Japan/US and Greece/Italy/Spain that’s frequently overlooked. Both Japan and the US issue debt in their own currency and are the monopolist supplier of their currency; thus, they ALWAYS have the ability to pay back the debt (through printing money) and thus should they default it’s because of their willingness to do so (see US Debt-Ceiling muppetry!). In the case of Greece/Italy/Spain they’re not the monopolist supplier of their currency and as such default is solely a question of their ability (or perceived ability) to pay off this debt. The same is true for countries that issue their debt in foreign currencies (e.g. Germany’s reparations post-WWI, or large tracts of Iceland’s debt before the Financial Crisis) as they are (by definition) not the monopolist supplier of these currencies.
Currencies: This discussion leads us nicely onto Greece, and the most recent bailout mechanism. Much like the (2 or is it 3 or 4) previous bailouts of Greece, the current one doesn’t offer any solution merely another effort to buy more time. In the end, basic arithmetic is working against Greece as even with generous assumptions it is likely that 23%+ of Greek government revenues** are needed to pay interest on their debt (no principal) before they even get around to providing any services. Clearly, that’s not a sustainable! So what does it require for Greece to go bankrupt and default? I actually think that’s simple; you need the French/Germans to not want to give/transfer their taxpayer money to Greece, and that requires France/Germany to be suffering enough economic pain, such that the political will to bail out Greece ranks behind the desire to help out French/German voters. Thus, it’s most likely Greece goes bankrupt when there’s the next bear market/recession (and Greece going late in that). Why’s Our Man still happy to be S the Euro…well, currencies are a relative value game and the for all the US’ faults, Europe is still uglier.
* Yes, the title was a gratuitous lead-in to bask in some of Mrs. OM’s photography from our recent holiday!
** How did Our Man come up with this number:
By generously assuming things haven’t got worse since 2010 (i.e. Debt/GDP stays constant) and using 144% Public Debt to GDP, a 6% interest rate on debt (vs. 16% 5-Year yield, currently), and Government Revenue of $114.5bn on a $305.4bn economy (thus revenue = 37.5% of GDP). Which gives us 144% * 6% = 8.64% of GDP spent on interest payments, or 23.05% of government revenue used solely for interest payments.
Saturday, July 16
June Review
Portfolio Update
Our Man is back from his vacation, so a brief but late update on June, which saw changes to the portfolio.
Performance Review
June was a thoroughly disappointing month, with the portfolio falling into negative territory on the 2nd and never managing to clamber back into the black. For the vast majority of the month, until the final few days, the book was down in the 25-75bps range but the book suffered as the market rallied strongly in the final days and ended up -2.1% (-1.5% YTD). However, this sharp negative performance late in the month should not disguise the portfolio’s weakness, with pretty much every book contributing to the poor performance.
The Treasury Bond book (-63bps) and the Bond Funds (-16bps) were the main contributors to the end of the month swoon, giving up their gains, as the fears over the ongoing problems in Greece after the country’s parliament approved another austerity program.
The Value Equities book (-87bps), as both THRX and DRWI fell heavily during the month and was the largest negative contributor. DRWI suffered from continued uncertainty over its short-term outlook after management reduced their guidance for their fiscal Q1 (May-end). While this hurt the stock, the long-termstory is largely unchanged and the position is well-sized to cope with the interim volatility. Theravance (THRX) had a larger impact on the portfolio, despite announcing reasonable Phase II trials together with Glaxo; the company is still developmental and has limited current revenues and thus suffered as market risk aversion rose and investors moved towards less risky companies. The NCAV equities (-22bps), which consists of 9 micro-cap companies, also suffered from the increased risk aversion. The Other Equities (-5bps), Energy Efficiency (-5bps) and China (-2bps) all hampered performance, with the Puts/Hedges book (+2bps) offering the only (and minimal) respite.
The Currencies book (-7bps) was up for most of the month as concerns surrounding Greece’s fiscal problems affected the Euro, but ending up costing money after the Euro rallied once the Greek Parliament approved further austerity measures.
Portfolio (as at 5/31 - all delta and leverage adjusted, as appropriate)
36.0% - Treasury Bonds (Aug-29 Bond & TLT, and 60bps premium in TBT Jan-13 puts)
22.0% - Bond Funds (VBIIX, DLTNX and HSTRX)
5.5% - Value Idea Equities (THRX, and DRWI)
3.0% - NCAV Equities
2.6% - Other Equities (NWS, CMTL and SOAP)
36.0% - Treasury Bonds (Aug-29 Bond & TLT, and 60bps premium in TBT Jan-13 puts)
22.0% - Bond Funds (VBIIX, DLTNX and HSTRX)
5.5% - Value Idea Equities (THRX, and DRWI)
3.0% - NCAV Equities
2.6% - Other Equities (NWS, CMTL and SOAP)
0.4% - Energy Efficiency (AXPW)
-0.1% - China-Related Thesis (7bps premium in FCX put)
-1.3% - Hedges/Put Options (13bps premium in S&P Dec-11 puts, 16bps in IWM Jan-12 puts, and 33bps SLV Jan-12 puts)
-1.3% - Hedges/Put Options (13bps premium in S&P Dec-11 puts, 16bps in IWM Jan-12 puts, and 33bps SLV Jan-12 puts)
-6.7% - Currencies (EUO – Short Euro)
27.7% - Cash
27.7% - Cash
Tuesday, June 28
How long does it take to create a financial religion?
Since Our Man is heading off (with Mrs OM) on his holidays tomorrow, he thought he’d leave with you with something to ponder in his absence. Sadly, it’s not some bright new revelation that he’s going to ask you to ponder…but one strongly related to something he discussed in this blog’s early days.
How long does it take for the financial patterns to become so culturally ingrained, that investors can’t help but slavishly adhere to them?
Well, if Our Man had to guess (and he does, else this post wouldn’t be much use otherwise), he would wager a maximum of 30-40years. Why? Well, that seems to be the length of time it takes for a full financial cycle to run its course. The graph below shows the most recent full cycle for bond and equity yields.

What if this religious belief in the lock-step move of bond & equity yield has ill-prepared the equities are cheap crowd? After all, their rationale makes logical sense (equities and bonds compete for a share of the investment portfolio) and the historical data, especially since the bull market of 1981-200, seems to back up their case.
And what if the sharp bond yield rises of the 70’s have ill-prepared the bond vigilantes for what comes next? They know what happens when inflation gets out of control – and it must do with the FED printing like crazy, right?
Why would they both be getting misled – as with everything, perhaps we should look at the whole picture…

Will the relationship exist should using interest rates loses its primary role (due to a zero-interest rate policy) and effectiveness as monetary tool. What if bond and equity yields decouple like we’ve seen in Japan? (Our Man does have certain expectations…)


What of the carefully nurtured “bond yields down, stock prices up” financial religion then?
Subscribe to:
Posts (Atom)