Pages

Showing posts with label Shipping. Show all posts

Tuesday, October 13

2026: Third Quarter Review

Portfolio Update 
- Brazil:  OM re-entered Brazil (EWZ, iShares MSCI Brazil ETF) early in the third quarter, as it now better fits OM’s standard dislocation framework.  A cheap market (second cheapest globally) that has frustrated investors by going nowhere for 20-years, but where things are improving and there’s a catalyst for change with October elections (especially if the younger Bolsonaro wins over Lula).   Somewhat ironically, OM moved Brazil to a Dislocation in late 2022 on Lula’s return. Unlike his first stint, Lula fell back on old habits, favoring state spending over reform, and the opportunity was squandered. The position also reflects a broader geopolitical view – Latin America is drifting rightwards (see recent elections in Chile, Bolivia, and Ecuador) and towards the US rather than China. 

- Uranium: Our Man re-entered URNJ in early August; both the term price and spot price have increased over recent quarters while uranium miners corrected by ~50% from their peak.   The good news is that OM re-entered at a price ~20% lower than his earlier exit and has room to add to the position.  The bad news is the stock prices have kept going down…

- AI & Semis: The sharp 30-40% pull back in Memory stocks (DRAM) allowed OM to enter the DRAM position discussed last quarter.  The positioning is relatively small, reflecting that it remains an attractive investment even if the most explosive part of the theme is unfortunately behind us.


Performance and Review
Our Man’s portfolio fell -0.6% during the third quarter, lagging both the S&P 500 TR (+2.3%) and the MSCI World (+1.8%). The underperformance was concentrated in September, when the portfolio fell -3.9%, while the S&P 500 TR (-0.4%) and MSCI World (-0.8%) had more muted losses.   The portfolio had outperformed slightly across July (+0.0%) and August (+3.3%).

For the year, the portfolio (+7.8%) sits behind the S&P 500 TR (+12.7%) and MSCI World (+12.4%).

The medium-term history of the portfolio is below:


Third Quarter Attribution
Shipping/Tankers (+408bps) was the largest contributor to performance during the quarter.  OM ran his historical posts and thesis through Claude and asked for its opinion on the position.   Suffice to say that Claude was not a fan;

  • Tanker rates are historically high, driven by the Russia/Ukraine and the Iran conflicts more than structural tightness
  •  Valuations are no longer very cheap
  •  Owners have placed record orders for new ships
  •  New IPOs/secondaries in the space (the historical sign of a top in the markets).   

To be fair, Claude isn’t wrong about how this ends.  It perhaps, lacks the imagination to see how far things can run before then.

The conflicts are increasing demand from both longer routes (US to anywhere) and inefficient trading patterns (see here for a prior example), while sanctions and attacks are reducing supply.   In physical markets, unlike software, the price reaction and profit flow-through are non-linear.   At the start of 2026 it cost ~$30K/day to charter a supertanker from the Middle East to Asia.   Claude was right to be aghast when spot rates reached ~$300K/day, and to expect mean reversion.  Instead, spot rates have climbed to over $1M/day, dragging recent 1-year time charters above $300K/day.  With costs largely fixed, most of this drops straight to the P&L.  Tanker companies are expected to earn a typical year’s earnings in Q3 alone, and recent trading statements (e.g. DHT) have indicated Q4 will surpass even the most bullish analyst expectations, with much of it being returned to shareholders.

OM held the full position through Q3, though has crystallized the 2026 profits in recent days after the trading statements came out highlighting the impact on Q4.   The supply response is inevitable, with VLCC super tanker orders in 2026 already running at multiples of 2024 and 2025’s orders, and maybe one of the many peace deals will eventually be real. 

The positions in the US Reindustrialization theme (-233bps) and Uranium (-231bps) were both hurt by a combination of higher Treasury rates and AI funding fears.  With Treasury yields continuing to rise during the quarter, and a WSJ analysis revealing significant off-balance sheet commitments from major tech companies, investors cut exposure to AI-related industrial names.  This reduction in exposure saw outflows from both AIRR and the Uranium ETFs, which forced further selling.   Uranium stocks declined, despite the decent underlying uranium price moves, as concerns grew whether new plants would be commissioned and built in the West especially given a number are tied to AI-data centers.   OM remains more sanguine than the market here as uranium will be undersupplied before these new build plants are operational – they add to a future uranium deficit, rather than impacting the next few years.  

Argentina (-181bps) suffered from higher Treasury rates and an increased risk premium.  This was amplified by worries that the Argentine economy was slowing, with the rate of loan growth guidance reduced at Grupo Financiero Galicia, and fears about Milei’s chances in the 2027 election. 

Elsewhere there was strong performance from Tin (+89bps), Brazil (+48bps), and Commodities (+45bps), which all benefited from broad strength in the commodities market.  Brazil also benefited as electoral polls tightened during the quarter.   Tin remains the most interesting of the commodities exposures.  Supply is both waning naturally and being disrupted, demand continues to grow (especially in electronics), and the stocks are cheap either due to location (Alphamin) or uncertainty over capital allocation (Metals X).

There were limited contributions/detractions from AI/Semis (+12bps), Idiosyncratic (+13bps), Carbon (-14bps) and UK/European Financials (-18bps). 


Portfolio (as at 09/30/26 - all delta and leverage adjusted, as appropriate)
Dislocations: 47.1%
17.3% - Uranium (URNM & URNJ)
10.5% - Brazil (EWZ)
7.5% - Tin (AFMJF, MLXEF and SBWFF)
6.6% - Commodities/Mining (LUNMF, TLOFF, PMCOF and IVPAF)
5.1% - Argentina (BMA, GGAL, SUPV)


Thematic: 42.4%

12.8% - Shipping/Tankers (STNG, INSW, TNK, DHT and FRO)
9.9% - European/UK Financials (BCS, LYG, NWG)
8.1% - US Reindustrialization (AIRR)
7.4% - Carbon Credit Allowances (KCCA)
4.1% - AI/Semis (DRAM)

Idiosyncratic: 2.6%
2.6% - Equities (JOE)

Shorts/Hedges: 0.0%

Cash: 7.9%

Disclaimer: Nothing above should be considered investment advice or a recommendation to buy or sell any security. While Our Man is invested in all of the securities mentioned, that alone is a terrible reason for anyone else to be. Our Man also holds some cash and a few other positions (of negligible value). Investors should always do their own work and make decisions based on their own circumstances, objectives, and risk tolerance—and not because Our Man happened to mention something here.

Sunday, April 12

2026: First Quarter Review

Portfolio Update 
- After an extended period without the anticipated rebound, OM exited substantially all Blockchain exposure (with Bitcoin at approximately ~$75K). While the position was given time to recover, that near-term bounce did not materialize as expected and OM exited.  OM may look to re-enter at more attractive levels should a broader market dislocation occur. 

-  OM also exited almost all the India exposure. The decision reflects relative opportunity set considerations rather than concerns with the underlying thesis, with similar investments (notably Brazil) offering more compelling risk/reward at this stage.

-  Following a strong start to the year, OM trimmed its US Reindustrialization exposure after it reached approximately ~12% of NAV.  The theme remains core, supported by continued momentum in domestic industrial policy and infrastructure investment. However, given strong performance and elevated positioning, partial de-risking was appropriate. The portfolio retains meaningful exposure.

Cash now sits at ~15% of NAV. Despite this, the portfolio remains positioned for volatility, with a meaningful allocation to dislocation-driven and commodity-linked exposures.

Performance and Review
Our Man’s portfolio rose +4.0% during the first quarter, outperforming the S&P 500 TR (-4.3%) and the MSCI World (-3.2%).  However, performance was marked by elevated volatility; with strong gains in January (+13.2%) and February (+1.6%) followed by a sharp pullback March (-9.6%).   

The volatility reflected the underlying positioning—particularly exposure to commodities and US Reindustrialization—both of which are sensitive to shifts in sentiment and risk appetite. Early strength provided an opportunity to reduce exposure selectively, though OM could have been more aggressive (e.g. Uranium).

The medium-term history of the portfolio is below:


First Quarter Attribution


The first quarter was unusual and, at times, chaotic. January in particular saw a near indiscriminate rally across most positions, with the notable exceptions of Blockchain/Crypto and India. That kind of broad price action across the portfolio is typically not sustainable and, in OM’s experience, is better used to reduce risk than chase further upside. 

Uranium (+347bps) and US Reindustrialization (+147bps) were the primary drivers of performance.

Uranium continues to reflect a structural supply-demand imbalance. Demand is increasingly supported by reactor life extensions and new project pipelines, while market pricing still assumes a relatively efficient supply response that has yet to show signs of materializing at scale. The disconnect remains in expectations rather than fundamentals.

US Reindustrialization reflects a broader policy-driven shift toward domestic capacity rebuilding. Markets continue to underweight the durability of this trend, treating decades of deindustrialization as structurally irreversible rather than a policy choice. That gap between perception and policy trajectory remains the core driver of returns, though it also increases sensitivity to sentiment shifts.

Elsewhere, Tin (+10bps) and broader Commodities (-9bps) ended the quarter roughly flat, but not without significant volatility along the way.

Shipping/Tankers (+374bps) was again a meaningful contributor during a time of uncertainty in the oil markets. Disruptions in key transit routes—most notably around the Strait of Hormuz—have increased effective shipping distances and constrained effective supply, pushing rates higher. We’ve seen versions of this before: when routes become inefficient, short-term tanker earnings can move well beyond even best-case assumptions.  The question is always duration. These conditions don’t persist indefinitely, but they also don’t normalize quickly. In the interim, capital allocation discipline across the sector has improved, with a greater share of earnings being returned to shareholders. Valuations reflect reasonable normalized earnings, though the position is expected to naturally decline over time as dividends are realized

The Idiosyncratic Equity position in JOE contributed +16bps.

Losses were broadly distributed, with the largest detractors coming from European/UK Financials (-131bps), Argentina (-126bps), and China (-44bps). The common factor was rising macroeconomic uncertainty, compounded by geopolitical risk, including US/Israel-Iran tensions and ongoing US-China frictions (e.g. the postponed Trump-Xi meeting didn’t help sentiment).

Carbon Credit Allowances (-98bps) were again a detractor. While the regulatory direction remains supportive over the medium term, the sizable impacts were pushed further into 2028, later than expected. This timing shift weighed on near-term pricing, despite reinforcing the longer-term supply tightness thesis.  At current levels, prices are approaching the regulatory floor price, which should limit downside. The upside case depends on whether CARB successfully implements the changes in a timely manner over the next ~6 months. The obvious risk is political—energy affordability is an easy place for pressure to build, particularly if broader geopolitical issues persist – though Governor Newsom is incentivized to encourage implementation before his term ends.

The India (-19bps) and Blockchain/Crypto (-69bps) were largely crystallized in early February as the positions were exited.


Portfolio (as at 1/1/26 - all delta and leverage adjusted, as appropriate)
Dislocations: 47.5%
24.6% - Uranium (URNM & URNJ)
6.8% - Commodities/Mining (LUNMF, TLOFF, PMCOF and IVPAF)
6.6% - Argentina (BMA, GGAL, SUPV)
5.8% - Tin (AFMJF, MLXEF and SBWFF)
3.7% - China (KWEB, FXI and JD)

Thematic: 35.5%
10.0% - Shipping/Tankers (STNG, INSW, TNK, DHT and FRO)
9.1% - US Reindustrialization (AIRR)
8.8% - European/UK Financials (BCS, LYG, NWG)
6.9% - Carbon Credit Allowances (KCCA)
<1.0% each in residual Blockchain/Crypto and India

Idiosyncratic: 2.6%
2.6% - Equities (JOE)

Shorts/Hedges: 0.0%

Cash: 14.3%

Disclaimer: Nothing above should be considered investment advice or a recommendation to buy or sell any security. While Our Man is invested in all of the securities mentioned, that alone is a terrible reason for anyone else to be. Our Man also holds some cash and a few other positions (of negligible value). Investors should always do their own work and make decisions based on their own circumstances, objectives, and risk tolerance—and not because Our Man happened to mention something here.

Thursday, May 30

Portfolio Update: May 2024 - Part I - There's a Supply Deficit

OM was starting to write a short note on the current market environment, but finds those notes dull to consume and OM has little original to say. Broadly, OM’s market view can be summarized as  - things aren’t as good as we’d like but not as bad as people think, though inflation is likelier stickier than the Fed would care to admit.

However, Our Man has made several meaningful changes to the portfolio over the last few 6 months, largely reflecting opportunities that he’s been watching for a while.  As such, it’s probably a good time for a portfolio update – in two parts, so it doesn’t become too long and unwieldy.

Portfolio Update – Part I – There’s a Supply Deficit
The broadest theme across OM’s portfolio is that of a supply deficit; primarily where an under-investment in supply coupled with a slight growth in demand has resulted in the supply deficit.   The theme is most obviously seen across numerous commodity markets, which represent about 1/3 of OM’s exposure.   More generally, this is something that impacts physical markets (commodities, goods, etc) and because of the rise of digital/software driven business models over the last decade+ OM think investors are poor at truly understanding the impacts.   One of attractions of digital/software business models is that marginal cost is (almost) zero and supply is (almost) unlimited.  For example, if I want to use Microsoft Office on my computer, the cost is almost nothing to Microsoft and my usage has no negative impact on your use of Office on your computer.  However, this doesn’t hold true in the physical world – if I use this barrel  of oil then you cannot, and if there is a supply deficit we are effectively competing to use that barrel of oil leading to a very different impacts on price.

Uranium (24.3%) remains OM’s largest position as it is the purest expression of the supply deficit.  Given the 7-year plus time horizon to successfully permit, build and begin to operate a uranium mine, the supply side is relatively easy to project.   Uranium’s sole end use is as they key component in fuel for nuclear power plants, who purchase it under long-term contracts.   Over the last few years, OM has noted the sharp turnaround in sentiment towards nuclear power.  This has seen nuclear power become accepted as part of the clean energy solution (including within the EU’s green taxonomy/bond program), increased uranium demand through life extensions for nuclear plants (even in the US!) and plans for new plants globally.   This imbalance of projectable supply and increasing demand has not gone unnoticed by the markets with both the Uranium price and the mining stocks up multiples over the last few years.  Despite this, OM retains a sizable position believing that while we’ve reached the ‘end of the beginning phase’ there remains further to go.  Why?  The largest miners keep missing production targets, the best assets keep extending their timelines to start production, the US is determined to wean itself from Russian uranium fuel, the continued nuclear plant extensions and starts bolster demand, and finally the largest banks are only now starting to cover the sector.

OM sees similar dynamics are playing out across Commodities/Mining (1.3%), and in particular in the smaller Tin (7.8%) market.  The supply deficit in the Tin market continues to edge closer as supply in Indonesia & Myanmar – major tin producers – run into problems.  The demand-side case continues to strengthen; as a reminder, ~50% of Tin demand is as solder, primarily as the ‘glue’ to make semiconductors – it is a direct beneficiary of the emergence in AI, and the subsequent demand for AI chips and increasing computing power.   Furthermore, Tin has no substitutes in the production of semiconductors, and has a no impact on the price of the end goods – the iPhone contains <25c worth of Tin, but wouldn’t work without out it.  If the tin price increased by multiples, it has almost no impact on end demand.   Finally, while commodities aren’t a core driver of the Brazil (4.7%) thesis, they are a meaningful contributor given the country (and its companies) are a major supplier of many commodities.   OM suspects that we’re seeing the impact of supply deficits in Uranium ahead of in other markets given the simplicity of its story.  As such, it’s likely that as OM’s exposure to uranium decreases over time, much of that capital will find its way into other commodity-related themes that are only starting to recognize the supply deficits in their markets.

Outside of commodities, the impact of limited new supply and increased demand is also clearly visible in Shipping/Tankers (12.1%), where positions have rallied strongly over the last 3-years.  This originally began due to the IMO 2020 changes but has been supercharged as a result of the Russia/Ukraine war.  We’ve previously discussed its impact on the demand side, but the sanctioning of tankers has also reduced supply.   The Russia/Ukraine war has had the effect of highlighting and exacerbating the imbalances in the tanker market, pulling some of the performance forwards and OM expects the position to continue to shrink over the short-to-medium term.

Elements of the supply deficit dynamic also help underpin some other positions including Idiosyncratic Equities (5.7%), Carbon Credits (2.3%) and Blockchain/Crypto (3.8%).  Both idiosyncratic equity companies (TPL and JOE) own real estate where there is increased demand for its usage be it through oil/gas drilling in the Permian (TPL), or increasing population and build out in Northwest Florida (JOE).  California Carbon Allowances are a man-made ‘environmental commodity’ where regulation specifically targets reducing supply over time to drive the price higher.   Finally, OM has added to the Blockchain/Crypto position – while the Bitcoin halving slows future supply, OM suspects that this 12-month post-halving cycle will be driven by Institutional FOMO (vs. prior halvings’ retail FOMO) now that exposure can be more easily obtained via ETFs.   

Part II will look over the rest of the portfolio...


Disclaimer:  Nothing above represents a recommendation in any way, shape or form so please don’t even think of trying to take it that way.  For added clarity, while Our Man is invested in all of the securities mentioned that’s a terrible reason for anyone else to do so.  Our Man also holds some cash and a few other securities (of negligible value).  You should not buy any of these securities because Our Man has mentioned them, but should do your own work and decide what’s best for you given your own circumstances/risk tolerance/etc.

Sunday, April 30

2023: First Quarter Update

Portfolio Update
There were no changes to the portfolio during the Quarter.

Performance and Review
OM’s portfolio posted a small gain of +0.8% to start 2023, which lagged the rising equity markets (S&P 500: +7.5% and MSCI World: +7.4%).  

First Quarter Attribution
 
The first quarter was largely uneventful for the portfolio with the positive performance driven by the exposure to Shipping/Tankers (+237bps), which continued their strong run.  The long-run structural case for Shipping/Tankers is one that is seen elsewhere in the portfolio; constrained supply due to long-term underperformance coupled with limited ability to quickly increase supply, all at a time when demand is inflecting upwards.  For tankers, the supply-side is the most attractive in decades for tankers with the oldest fleet in history, an order book (as % of fleet) at multi-decade lows and shipyards contracted out through 2025.  While demand had been steadily inflecting upwards, it jumped more meaningfully in 2022 due to the Russia-Ukraine war which altered hitherto efficient supply routes.  The upside for an investor in these types of investments is that the pain of the prior cycle means the market never quite believes that supply has rationalized, is unwilling to fund new supply and constantly expects disappointment and reversion to the historical mean.  This means that the opportunity can last longer (and potentially move higher) than it would otherwise, but the downside is that its performance will come in violent fits and starts.  This exceptional volatility – as every small downturn is assumed to be the end of the cycle, and as every rally converts more to the thesis but sees current prices extrapolated out – is the largest challenge for investors as prices will not move steadily alongside markets (i.e. there will be periods of massive under/outperformance) and investors must size positions at levels where they can suffer the downside.   

After a decade of disappointment, many commodity markets reflect this constrained supply, at a time of increasing demand, theme.  OM has concentrated the portfolio’s exposure primarily in Uranium and Tin, where the structural limits in supply and demand are particularly evident.  The Uranium exposure (-66bps) was a meaningful detractor in the quarter, while the Tin (-2bps) and other Commodity (-1bps) exposure were broadly flat.

OM benefited from some mean reversion in Blockchain (+50bps) and Software (+5bps), which had both been material underperformers in 2022.   These names were both also helped by the expectation that interest rates were peaking and would fall, following the failure of Silicon Valley Bank in March.   The change in interest rate expectations hurt OM’s play on Higher Medium Term Interest rates (Short/Hedges, -103bps).

Elsewhere performance was a mixed bag ranging from negative contributions in Idiosyncratic (-51bps), India (-29bps) and Biotech (-23bps) to a positive one from Greece (+71bps).  Brazil (-4bps) was a small negative detractor but remains the position OM is most likely to add to alongside Uranium and Tin.  In addition to the return of Lula as President, the Brazilian Central Bank was more proactive in managing inflation (increasing rates from 2% to almost 14% from the early 2021) and is now reaping the benefits of that.   

Portfolio (as at 4/1/23 - all delta and leverage adjusted, as appropriate)
Dislocations: 22.5%
20.6% - Uranium (URNM, CCJ, NXE, PALAF, DNN, BNNLF, URG and SMR)
1.9% - Brazil (EWZ)

Thematic: 46.8%
15.1% - Shipping/Tankers (STNG, INSW, EURN, TNK and DHT)
9.2% - Tin (AFMJF, MLXEF and SBWFF)
6.0% - India (IBN, INDA and SMIN)
4.8% - Biotech: 4th Industrial Revolution (IBB & XLB)
4.4% - Greece (GREK & ALBKY)
3.0% - Blockchain/Crypto (ETHE and OSTK)
2.5% - Software: 4th Industrial Revolution (JD & WCLD)
2.0% - Commodities/Mining (FLMMF)

Idiosyncratic: 6.0%
6.0% - Equities (TPL & JOE)

Shorts/Hedges: 5.5%
5.5% - Higher Medium-Term Rates (PFIX)

Cash: 19.3%

Disclaimer:  Nothing above represents a recommendation in any way, shape or form so please don’t even think of trying to take it that way.  For added clarity, while Our Man is invested in all of the securities mentioned that’s a terrible reason for anyone else to do so.  Our Man also holds some cash and a few other securities (of negligible value).  You should not buy any of these securities because Our Man has mentioned them, but should do your own work and decide what’s best for you given your own circumstances/risk tolerance/etc.  


Wednesday, September 21

Portfolio Update – September 2022

A small note on the current environment and market; economic conditions are uncertain and are being impacted by a cross-current of conflicting short and longer-term trends.  These include the consequences of the COVID-19 lockdowns and the subsequent multi-speed re-openings, the varying amounts of fiscal and monetary support provided during COVID, a decade+ of loose monetary policy, and rising inflation caused in part due to supply constraints and as a result underinvestment in commodities that have been exacerbated by the Ukraine/Russia conflict.  As a result, there has been contradictory signals across countries and within different parts of the economy and markets, meaning there are a broad range of outcomes for both growth and inflation and there is data to support almost any view.

Market wise this has led to increased uncertainty and higher rates, which have been bad for stocks and credit.  It has also seen a tendency for the market to extrapolate limited datasets to smooth the uncertainty but then have sharp reversals when contradictory data comes out.  This is further compounded by the uncertainty over the Fed’s preference function due to the absence of inflation over a prolonged period.  What matters most to the Fed between inflation, financial sector stability, economic growth/unemployment, currency strength/stability, etc. and by how much?   

OM’s market view can be summed up as 🤷 with reasonable cases able to be made for almost any stance.  However, Our Man made several changes to the portfolio in early September.  These largely reflected some structural things that OM has been pondering a while with the most notable being profit-taking in Shipping/Tankers and the elimination of the Funds bucket of the portfolio.

For a broader round-up, and thoughts on the various buckets, please see below:

Uranium: 25.4% NAV
Marginal change, through the reduction in the Paladin Energy (PALAF) position
Since its inception, the uranium position has primarily been about the supply deficit and how higher prices would be needed to encourage greater supply.  While there have been signs of changes in the perception of nuclear generation and potentially increased demand (i.e. new power plants) over the last couple of years, the conflict in the Ukraine and resulting energy issues have acted as a catalyst and brought things to the fore.   So far in 2022, we have seen the UK lay out a strategy to build 8 nuclear power plants, Japan signal a return to nuclear power, the US further support its nuclear plants including the Inflation Reduction Act and California trying to u-turn on closing the Diablo Canyon nuclear plant, not to mention a spate of plans for small-modular reactors in Europe.  This unexpected increase in future demand merely underscores the supply deficit and potential upside for uranium.


Shipping/Tankers: 12.6% NAV
Major change through sale of ~40% of the position across all names
The decision to trim the position was relatively easy as OM the Shipping/Tankers position is up 100%+ in 2022.   Tankers have been a significant beneficiaries of the energy market turmoil caused by the Ukraine/Russia crisis.  As simple example, pre-conflict a small Aframax tankers would fill-up in Russia make the short run to Europe (Rotterdam) and then head back to refill.   Due to the conflict this has become something akin to a couple of Aframaxes fill up in Russia, head out to sea to a ship-to-ship transfer to a larger VLCC, which then travels all the way to India or China (and back again), while other tankers service Europe with oil from the US or Middle East.  While this is a massive simplification it’s a good demonstration of how inefficient today’s reality is compared to pre-conflict!   Tankers are traveling a lot of extra miles and with fixed supply, unsurprisingly price is the variable that has changed.

So why keep the position (and in larger size vs. end-2021).  The tanker fleet is getting old and the order book is the lowest since 1996 so supply will be constrained for a long time.  Furthermore, while Tankers will be hurt if/when there’s a resolution in Ukraine and/or a recession, we’re also unlikely to revert to the pre-crisis trade routes.  This is especially the case when we look at where the oil is being exported (US oil production/exports near all time highs), where the refineries are and where the end consumers are.  

Given the above, OM leans to the view that the dislocation phase of the tanker trade is over, and the tanker market super cycle is finally beginning.  To reflect this, OM will move Tankers from dislocation to thematic at year-end.  The operating and financial leverage (and shady management) in the businesses means it won’t be smooth sailing and the position sizing reflects that and the thematic nature.   


Tin: 8.3% NAV
Minor change through increasing the position in Alphamin Resources (AFMJF)
The tin price has been very volatile over the last year; the current $21K price is down over 50% from its 2022 peak yet also near historical pre-COVID highs.  However, there’s been little change to the long-term outlook and the same demand-supply dynamics remain (https://ourmaninnyc.blogspot.com/2021/05/the-adventures-of-tintin.html).  OM took the opportunity to add to the Alphamin position; it is a largely debt free company that’s profitable at these prices as the lowest cost major producer, and it also has the largest untapped tin deposit adjacent to its existing mine.

 
International: India (6.7% NAV), Greece (3.5% NAV) and Brazil (2.2% NAV)
Minor change, exiting Vietnam but adding to Brazil
The position in Vietnam was exited – while Vietnam will benefit from supply chains being diversified from China, it’s more likely that many of these supply chains will be brought back to Americas than prior to COVID/Ukraine.

OM added to the position in Brazil – it’s a commodity rich country, with a cheap market, where interest rates (at 13.75%, from 2020 lows of 2.00%) are nearer the end of their cycle and with a pivotal election later this year.  It’s something OM continues to spend more time on, and if it’s going to be sized up meaningfully then OM will write in greater depth.   OM is additionally looking at Turkey, as a potential investment idea.

 
Equities/Funds: 5.6% NAV
Major change: exited all of the Funds’ positions (GVAL, CWS, ARTTX, and CAPD) and added marginally to JOE.
The biggest change to the portfolio was OM exited the Funds’ positions.  This is something that OM has been toying with for much of the last year – the positions were introduced a while ago to provide some consistent equity exposure as OM was chronically underinvested.  Today, OM has vastly more ideas, greater conviction in them, and a better understanding of his own investment style.  As such, there’s somewhat less need for the Funds positions and their capital will be allocated elsewhere.


Software/Tech (2.8% NAV) and Biotech (5.0% NAV)
No changes, though both Software and Biotech are approaching levels that are beginning to get attractive.


Carbon Credits: 0.0% NAV
OM exited the position in Global Carbon Credits (KRBN)
While OM is intrigued by the Carbon Credits space, in part because it would take a material event to push Europe and California away from believing their carbon cap-and-trade systems were part of a green solution.  Unfortunately, the Ukraine conflict and its impact on energy and electricity prices in Europe is such a material event.  With Europe representing 50-60% of KRBN and a debate beginning to emerge (https://www.euractiv.com/section/emissions-trading-scheme/news/eus-von-der-leyen-rebuffs-polish-call-to-suspend-carbon-market/) over pausing Europe’s cap-and-trade system, OM decided to exit the position.  However, you should expect to see it back in the portfolio in the future though it may be expressed differently (e.g. KCCA, which just reflects California’s Carbon Allowance system and is trading much more attractively).


Blockchain: 4.1% NAV
Marginal Change; exited Bitcoin (GBTC) but added to position in Overstock (OSTK)
OM was long overdue in exiting the Bitcoin investment, which turned a great profit into a healthy one.  The capital was largely reallocated to the position in Overstock (OSTK).  The broad outline of the case for OSTK is largely unchanged since OM’s original write-up.  The developments include the Founder/CEO departing and Overstock moving its blockchain assets into a vehicle that’s managed by a professional VC.   The most prominent of these blockchain investments – tZERO Group – is a blockchain based exchange that is regulated by the SEC and FINRA.  It received a strategic investment from Intercontinental Exchange (ICE, who run the New York Stock Exchange) earlier this year, which saw David Goone (a long-time ICE executive) become tZERO’s CEO.


Commodities: 1.5% NAV
No changes.  
OM is tentatively interested in increasing the size of this bucket, especially if recession fears increase and prices become more attractive.  After a decade of underinvestment there are supply/demand imbalances across many commodities, which are a core component of electric vehicles and the buildout of renewable energy.  However, OM is cognizant of the strong correlation of this bucket with a number of others in the portfolio (e.g. Uranium!), especially when markets are stressed or recession fears increase.


Shorts/Hedges: 5.7% NAV
Marginal change; added to OM’s position in PFIX
OM expects that future interest rates over the next 5-7 years will be higher than historical ones over the last 5-7 years.  For simplicity, PFIX invests ~50% of its capital into a US Treasury Bond (5-year) and uses the balance to purchase put options at 4.25% on the 20-year rate, expiring in May 2028.  In essence, with the value of the Treasury Bond providing a floor for PFIX should OM be wrong, the option provides substantial upside should medium term rates move beyond 4.25%.


Cash: 16.8% NAV
As a result of the portfolio changes, especially the liquidation of the Funds and reduction in Shipping/Tankers, OM is holding substantially more cash.  This cash level reflects OM’s view of the uncertainty in the economy and markets but expect OM to slowly start to invest it as either this fades or prices become more attractive.


Disclaimer:  Nothing above represents a recommendation in any way, shape or form so please don’t even think of trying to take it that way.  For added clarity, while Our Man is invested in all of the securities mentioned that’s a terrible reason for anyone else to do so.  Our Man also holds some cash and a few other securities (of negligible value).  You should not buy any of these securities because Our Man has mentioned them, but should do your own work and decide what’s best for you given your own circumstances/risk tolerance/etc. 

Tuesday, March 31

Shipping/Tankers: Can you spell C-O-N-T-A-N-G-O?

Yup, it’s yet another Tankers post!  If you think that all OM talks about is tankers, you’d be right and Mrs. OM and his colleagues can vouch for that! 

After the last update, OM kept buying tanker stocks until finally reaching the “stop buying” limit of 25% NAV on March 23rd.  This article helps explain why.

It was just over a year ago when OM first wrote about tankers, and November's update laid out the thesis' key points:
  • Tanker Supply:  After years of oversupply, the tanker markets were finally tight with order books well below historical averages.  With the supply of vessels fixed in the short-run, small changes in demand can have a big impact on tanker rates.
  • Operating (and Financial) Leverage:  The operational leverage of tankers, where most of the costs are fixed, means that a small change in rates has a massive impact on the P&L.
  • Valuation:  The fall in the tanker stocks during January/February 2020 took valuations back to the early 2019 lows of 0.3-0.5x net asset value.
  • Impact of IMO 2020: OM felt that IMO 2020 was going to be the catalyst that brought tanker stocks to the attention of others.  This was largely proving to be the case, though rates are very seasonal, January’s was the best January in a decade and February was heading in a similar direction.  It has since been usurped...
So what changed?
In the last three weeks there have been major changes to both the demand and supply for oil:
  • Demand has collapsed.  In response to Covid-19 most of Europe, the US and India are on lockdown, while even the recovering parts of Asia (such as China) are only operating at 70-80% of historical levels.  Unsurprisingly, this has meant that the demand for oil and oil products has also collapsed, with some estimating it has fallen by 20 million barrels/day. 
  • Supply has increased.  In the first half of March, OPEC+ couldn’t come to an agreement to reduce oil production after the Russians balked at further cuts.  Saudi Arabia responded by stating it would increase its own production by 2-3 million barrels/day and offering discounts to key customers.
These factors have led to the oil price plummeting.  It has also created two interesting things for tankers; the surplus of oil (10-20mn barrels/day) needs to be stored somewhere and there is a huge contango in the oil markets.

Oil can be stored on land in tanks, at refineries, at oil terminals and in countries’ strategic oil reserves.  However, there’s only ~1 billion barrels of storage available globally and the oil has to be shipped there on crude tankers that move really really slowly! 

Oil can also be stored at sea, in crude tankers, and the contango in the oil market is making this exceptionally attractive.   Contango is when the futures price of a commodity is higher than the current spot price.


This shows that magnitude of the contango, which is surpassing that of the Great Financial Crisis.  Today, someone buying oil and immediately hedging it six months out (by selling the future) can make ~$13.43 per barrel of oil profit, less the cost of storing it for 6 months.   Or put another way, you could make almost ~$27mn risk-free profit if you filled a VLCC tanker to store your oil.  How much to pay for that storage?  The answer has been a lot, the majority of your profit since the market for tankers is tight your profit is risk-free.  The impact of this is two-fold (i) its putting a floor on tanker rates, and (ii) every VLCC that’s used for floating storage is unavailable to transport crude (at a time when Saudi wants to increase production).  

What has this meant?
Well Q2 is typically the seasonal low for tankers as refineries go into maintenance and the deals signed today are for journeys in the second quarter.  Yet, as the chart below shows we’re seeing record rates – in fact rates haven’t been higher since the 1980s!!!

Source: Allied Shipbroking

The chart is for VLCCs, but you could substitute just about any crude or product tanker chart in there and it would look similar.

Will it last forever? 
Of course not but remember the operating leverage.  It means the sharp uptick in rates is dropping straight into the profits and free cash flow.  Combined with the low valuations, OMs tanker holdings are conservatively going to earn 25-50% of their entire market caps in just the first half of 2020.   Until last week, the market didn’t care and there’s a reason why this industry has seen companies and mgmt. aggressively buying shares!

It’s a perfect once in a generation positive storm; a tight tanker market, with massive excess supply and a huge contango incentivizing storage all at a time when cos are trading at low valuations.  


Disclaimer:  Nothing above represents a recommendation in any way, shape or form so please don’t even think of trying to take it that way.  For added clarity, while Our Man is invested in DHT, TNK, STNG, DSSSI and EURN - that’s a terrible reason for anyone else to invest in them.  You should not buy any of these securities because Our Man has mentioned them, but should do your own work and decide what’s best for you given your own circumstances/risk tolerance/etc.

Monday, March 16

Portfolio Update: No Más!

Our Man followed through with the things on his docket last week, reducing the portfolio’s exposure about 8-10% above Thursday's market bottom.  Frankly, OM hopes it’s a decision that looks abysmal in the future, since that likely means that COVID-19 came and passed quickly with limited impact.

The primary rationale for it was a combination of material year-to-date losses, increasing evidence of the West’s questionable handling of the COVID-19 outbreak, and the increased uncertainty caused by COVID-19.  
  • The losses began with Shipping’s sell-off in January and accelerated last week, as emerging market indices collapsed.
  • It appears that most of the Western governments were caught off-guard by the spread of COVID-19, and reacting to events rather than having proactive plans.   Bizarrely, the UK is an exception; it has a very clear plan though it is highly controversial and has been at least partially misunderstood.   If you’re in the UK you must read Azeem Azhar’s newsletter post on it.  If you're not in the UK, you should read it anyway.
  • The uncertainty around COVID-19’s impact is worth discussing as ideally one should be a buyer in weeks like last week when there is “blood in the streets”.  The argument for buying now is that this too shall pass, and numerous high quality stocks cheap on historical (or post-COVID-19) earnings.  Thus buying today is right, even if there’s another 10-20% downside, as these names will be markedly higher in 12-months’ time.  Normally, OM would nod in agreement.  However, with COVID-19’s spread to Europe and the Americas, the weak response and the potential multiple week lock-downs ahead OM believes the range of outcomes is exceptionally wide.  In the best case, it will look like nothing more than your typical economic or market slowdown and OM’s decision will be costly.  However, the impacts of a prolonged lock-down are non-linear; too many (both large and small) businesses have too thin margins, too many fixed costs, and too much debt to be able to survive with limited revenue for that long.  That starts to raise questions of the health of the economy we'll come back to post COVID-19.  OM suspects that in many scenarios, the solution is going to look a lot like MMT.

Portfolio Changes
The planned reductions to the portfolio were discussed in the previous post but were:
  • Technical Book:  The Technical Book’s sell signal flashed in the final days of February, but OM waited for a meaningful bounce that never really came.  He exited it at the close (thankfully!) on Friday, but the delay (vs. the first trading day of March) cost a couple hundred bps!
  • Greece:  OM cut this back materially.  It was the only particularly hard decision in the reduction of exposure.  The new government in Greece is largely doing very good job, including their fast response to COVID-19, but it doesn’t matter.  The economic rebound is going to be tested by COVID-19’s impact on tourism among other things, and Greek equities are going to get limited attention from investors.  The Greece ETF is trading below the levels when folks thought the country was run by a Crazy Leftist and about to leave the euro for the drachma.   This is why it’s still the 2nd largest position in the book.
  • Brazil, India & Vietnam:  Both Brazil and India saw their first COVID-19 cases during the week, which led to OM to slightly increase his reduction in those positions.  Longer-term, Vietnam continues to a beneficiary of broadening supply chains but was also reduced.
  • SaaS & Uranium:  The exposure to the older ETFs was cut back.  There are some more recently launched ETFs that better fit the theses, and OM will be adding these when the moment comes.  OM also trimmed back the JD.com position, which is up for the year.

OM also bought some more crude and oil product tankers!
In the week since OM’s last post on Shipping, Saudi Arabia and Russia started an all-out price water which saw oil prices tumble 30%+.  The combination of the attractiveness of storing crude & oil products and the Saudis hitting the bid on every VLCC tanker they could find saw tanker rates rise 4-8x last week!  This is the start of the low season, but instead rates are printing at all-time highs; there are ships that are literally making a year’s worth of income in a single 45-day voyage!!  OM added some Double Hull Tankers (DHT, crude tanker company with a fleet of VLCCs) but didn’t get filled in his attempt to buy Teekay Tankers (TNK).  If these rates continue and the stocks don't reflect it, expect OM to continue to keep buying more of his existing positions (and TNK) till he hits 25% NAV.    Given the cash flow that these companies are going to throw off in Q1 and Q2, OM is happy keeping this position at a much higher size though he’ll be selling lots of the rest of the portfolio to keep overall risk in check.  OM exited the existing position in Navigator Holdings (NVGS), which is focused on liquid natural gas not crude and oil products.


Portfolio (as at 03/13/20 - all delta and leverage adjusted, as appropriate)
Dislocations: 31.0%
17.9% - Shipping (STNG, DSSI, EURN, DHT and NVGS)
9.9% - Greece (GREK, ALBKY, and EGFEY)
3.2% - Uranium (CCJ and NXE)

Thematic: 15.1%
5.2% - Tech 4th Industrial Revolution (JD & WCLD)
3.4% - Vietnam (VNM)
3.3% - Brazil (EWZ)
3.2% - India (INDA)
0.0% - Blockchain/Crypto (no positions)

Technical: 0.0%
0.0% - OEW Technical positions (DDM, SSO, and QLD)

Idiosyncratic: 16.9%
14.2% - Funds (ARTTX, CWS, GVAL, and CAPE)
2.6% - Equities (TPL)

Shorts/Hedges: 0.0%

Cash: 37.1%


Disclaimer:  Nothing above represents a recommendation in any way, shape or form so please don’t even think of trying to take it that way.  For added clarity, while Our Man is invested in all of the securities mentioned that’s a terrible reason for anyone else to do so.  Our Man also holds some cash and a few other securities (of negligible value).  You should not buy any of these securities because Our Man has mentioned them, but should do your own work and decide what’s best for you given your own circumstances/risk tolerance/etc. 

Saturday, March 7

Shipping, wtf?

Almost 50% of Our Man’s losses in January and February came from the Shipping positions.  There's a broader post on OM's thoughts coming, but here’s a follow-up to the recent post on shipping.

COVID-19 was identified in January in China and there was a sharply bifurcated reaction in the market.  Initially, Western markets generally held-up well, but economically sensitive stocks exposed to China were dramatically impacted, before markets tumbled in the second half of February.  For example, energy names started falling in mid-January and continued to collapse in February; the S&P Energy Sector lost ~12% in January and then another ~15% in February.  In many cases, the losses in these sectors and stocks were at odds with fundamentals, which brings us nicely to Shipping!

Before we start, some things pulled from the last Shipping post as a reminder of the context around OM’s position:
  • It’s a high conviction Dislocation position that is fully sized and ‘on the clock’.
  • It’s treated as a quasi PE-position in the portfolio. This means it’s not a position OM looks to trade and it’s sized such that he’s willing to absorb the mark-to-market losses as long as fundamentals don’t change. In the long-term, OM expects to be paid for this volatility.
  • It will require patience and will power.
  • Here’s the plan!
 So with that said, it was barely a month or so ago that OM said he wouldn’t be reacting to every 20-30% move in shipping with a post. But a 30-50% move in crude & product shipping prices in 8 weeks was not pretty and deserves a post! The chart below shows OM’s position size and the P&L contribution from tankers:


Why so bad so fast? 
  • Seasonality: It’s a very seasonal business!  Investors should compare rates to this time in prior years rather than what they were a week or month ago!  Rates started to fall from their highs in January and this seasonality seems to have caught a number of investors by surprise!
  • China & Coronavirus: Anything that is a first order impact of the economic slowdown in China was sold, and sold heavily. Oil is down 30%+ from its early 2020 peak, and OM gets it crude/product tankers are a small ugly levered sub-sector that has something to do with oil. 
Given this what is OM doing? 
Well despite the coronavirus, economic slowdown in China, collapse in oil price, etc. the shipping day rates have held up remarkably well.  The below chart is for Medium Range (MR) tankers, but the rates for other tanker types show broadly similar stories. 

Source: Hellenic Shipping News, Allied

To add further context, despite everything many those rates are at or close to 10-year highs!

Thus, so far OM has done nothing.  There’s a huge dichotomy between shipping rates and its implications for companies’ revenue, earnings and cash flow, and the stock price action.  The stock price matters, the P&L matters, but position sizing matters most! This is where having a plan – the research, time frame, and data points you’re tracking for buying/selling – really helps.

At February-end, OM was largely back to his cost basis in individual names, with the overall position size much reduced as a % of capital.  As long as rates continue to track above previous years, OM won’t be selling.  If the discrepancy continues to grow between the market’s implied valuation and the companies’ likely earnings, he’s far more inclined to buy more.  Maybe a LOT more.  The stocks are trading at 0.5-0.8x NAV (or less than 1.0x EV/GAV, to account for the leverage) and at these rates they are generating a ton of cash. It won’t be today, it likely won’t be tomorrow but the longer the dichotomy persists and the less the stocks appear like a falling knife, the bigger a potential position OM is willing to countenance eventually taking. 

So what is he thinking on the individual names:
  • Navigator Holdings (NVGS):  The one name OM will likely exit.  It is a liquefied gas transportation company not a crude/product transportation one.  Expect it to come out of the portfolio as OM focuses entirely on crude/product tankers.
  • Scorpio Tankers (STNG):  OM will probably not add to this one as it’s the most levered.   The leverage makes it the one most likely to run into problems if the COVID-19 impact is prolonged.  If the impact is not prolonged, OM expects it will also be the one investors flock back to.
  • Euronav (EURN): The safest name with a strong balance sheet, good management, reasonable operational leverage and is cheap (trading at 0.7-0.8x P/NAV and EV/NAV).
  • Diamond S (DSSI): Refinanced its debt out to 2024, is very cheap (0.45-0.6x P/NAV and EV/GAV) but it has a stock overhang (PE lock-up rolls off in March 2020) and management has underwhelmed.
  • Teekay Tankers (TNK): This is a name that OM will be adding to the portfolio to replace Navigator Holdings.  It’s a midsize crude tanker play that’s trading at ~0.75-0.85x P/NAV and EV/GAV, which refinanced its debt and during the first quarter.  Its results summed up the stock price/rates dichotomy; a $12.50 stock (at the time) earned over $2.47 for the QUARTER and is expected to earn over $2.60 for the upcoming QUARTER! Yes it is high season, and yes Q2 and Q3 won’t be close to as good - though analysts still expect them to be profitable - so the market really has to believe things are going to get a LOT worse.
In summation, OM suspects we’ll look back in a year or so and either have a good chortle about how inefficient markets can be or we’ll sadly sup our beers and commiserate about how foolish OM was!

Disclaimer:  Nothing above represents a recommendation in any way, shape or form so please don’t even think of trying to take it that way.  For added clarity, while Our Man is invested in NVGS, STNG, DSSSI and EURN and may invest in TNK - that’s a terrible reason for anyone else to invest in them.  You should not buy any of these securities because Our Man has mentioned them, but should do your own work and decide what’s best for you given your own circumstances/risk tolerance/etc. 

Monday, January 20

How OM Thinks about Sizing Shipping

Given the recent and likely ongoing volatility, OM wanted to talk about how plans on managing his Shipping positions.  As such, this post is primarily a way to help OM clarify his own thoughts and commit them to paper.    

An advantage of being in the investment world over the last 20-years is that OM has seen many otherwise intelligent and rational folks make appalling investment decisions. Typically, these decisions come at times of stress and often around the investor’s high conviction positions! These experiences mean that OM his keenly aware that it is as important to protect your mental capital as it is your financial capital when investing.

This is particularly the case for OM’s position in Shipping. It will be very volatile; the underlying supply/demand dynamics mean shipping rates will fluctuate significantly, the operating and financial leverage of the stocks will add to this and the terrible history of the sector means the marginal investor will initially focus too heavily on short-term data points.   For Our Man’s portfolio, this is magnified further due to the size of the position – it is indubitably the highest risk position in the portfolio. That is not an oversight. 

So how to deal with this volatility and the uncertainty it will naturally engender? 
First of all accept it is coming and be comfortable with the consequences of that.  Shipping will likely dominate the moves of OM’s portfolio over the coming weeks, months and quarters.  It will happen regularly and so OM will not be writing up every 20-30% move up or down in the stocks, or adjusting the portfolio for them.

Second, remember why you’re invested.  For Our Man, it’s a high conviction Dislocation position that is fully sized and ‘on the clock’ now that the catalyst (IMO 2020) to engender investor interest has occurred. The goal for Dislocation positions is that they return multiples of invested capital within a relatively defined time period. To capture the compounding required to generate this performance, OM treats them more like private-equity positions. This means, the positions aren’t really resized or traded unless (i) the long-term thesis changes or (ii) the capital at risk in the position goes beyond OM’s preset tolerance.  

Currently, OM’s view is that “too much” capital at risk would be 25-30% NAV in Shipping and 10% in any of individual names. However, if OM’s thesis is correct then these max capital at risk levels will slowly decline.  So while Shipping is currently OM’s highest risk position, he’s comfortable with the potential mark-to-market losses and expecting to be paid for that risk.

The difficulty of dislocation positions is that even after the ‘catalyst’ they require patience and will-power. This will particularly be the case in Shipping, and Bob Farrell’s Rule Number Four (10 Market Rules to Live By) sums up what to expect.

“Exponential rapidly rising or falling markets usually go further than you think, but they do not correct by going sideways” -- Bob Farrell

Third, have a plan!  A plan is a starting point, and it should change over time as circumstances and data change. Here are the key elements to OM’s plan.  OM is primarily focusing on the fundamentals - relevant crude/product tanker shipping day rates and how they show up in company earnings. He is most interested in the general level of rates and how they compare to prior years, and less so with the short term moves.  The short-term changes will likely be substantial and inconsistent, and overly focusing on them is how you destroy mental capital through obsessing about the trees but missing the forest.  Remember, for Dislocation investments the time horizon for the thesis is 18-24mos (max 30mos), in this case from Jan 2020, so the longer-term levels and their trends matters more. Secondly, Shipping is a very seasonal sector and so comparison to prior years is more important than vs. recent months. Obviously, strong day rates should lead to strong corporate earnings (and potentially dividends), which will help attract other investors.

Meanwhile, understand it is shipping and the crappy history that created the opportunity means that new(er) investors will be skeptical. It will take day rates being meaningfully and consistently higher than previous years, and the companies showing they’re not spending their free cash flow on more ships for the investor community to start to get very interested. Until then, every downturn in rates will lead to “it’s the end of the cycle” comments.  This is another factor that will only exacerbate the volatility in both directions.

Fundamentals will also be the simplest and most important way for OM to be proven wrong.  So expect him to exit if (i) the recent rise in shipping rates is brief and cyclical and then they consistently look like 2018/2019’s rates, or (ii) better rates don’t flow through to company earnings and free cash flow, or (iii) companies repeat the folly of past cycles and order new ships!

What could make OM sell if he’s right?
If OM is correct in his thesis then there are two ‘rules’ – on position size and holding period – for Dislocation positions in addition to any qualitative rationale, for reducing/exiting positions.   As mentioned about these rules are of a typical holding period of 18-24 months (and 30 months maximum) from the narrative changing event (IMO 2020 on Jan 1st, 2020), and OM has set the maximum position size he’s comfortable with at 25-30% today (and 10% per individual position) though both will decline as the thesis progresses.

Assuming the fundamentals continue to trend well, then the qualitative decision is based around price, valuation and sentiment.  The extreme limits of these are easy to specify; expect OM to be well out of these names when you start seeing the companies trading at multiples of NAV, or read/hear about shipping companies as “high dividend names” or that shipping day rates will stay at elevated levels for years (i.e. the sector is no longer cyclical). Finally, Our Man is also watching to see when the names are added to different ETFs. While the stocks will certainly benefit from the wall of passive money flowing into them it’s a strong signal that the end is near for Shipping as a dislocation position in OM’s portfolio*.

Conclusion
Our Man hopes that the three points above – accepting that Shipping will be volatile (and will drive the portfolio’s short-term moves), remembering why he’s invested, and having a plan – will help him manage the shipping positions over the coming quarters.  He’s also listed some of the fundamental and other qualitative factors he’s watching to try and help prevent thesis creep, so expect updates on these during the quarterly reviews.   Finally, if you ever hear OM talking about how Shipping cos are high dividend names…then less than politely ask him what the hell he’s doing and remind him of this post!!


* For future reference, today the stocks are barely owned by ETFs – STNG (3.3% of market cap is held by ETFs), DSSI (2.5%) and EURN (2.1%).  For comparison, large bell weather stocks (AAPL, GOOGL, FB, BA, GE, etc.) have ~10% of their market cap owned by ETFs and some stocks can have 40%+ of their market cap owned by passive investors.


Disclaimer:  Nothing above represents a recommendation in any way, shape or form so please don’t even think of trying to take it that way.  For added clarity, while Our Man is invested in STNG, DSSSI and EURN that’s a terrible reason for anyone else to invest in them.  You should not buy any of these securities because Our Man has mentioned them, but should do your own work and decide what’s best for you given your own circumstances/risk tolerance/etc. 

Friday, November 22

Dislocation: Shipping Thesis - Update

A long update on shipping as Our Man took advantage of the pullback in product and crude tankers, and the increasing proximity of IMO 2020, to increase his Shipping position to 15% at the end of Q3. 
Unless IMO 2020 proves to be a completely damp squib (think Y2K!), it’s a position that Our Man doesn’t expect to trade much for the next year or so. However, should tanker companies start to trade at multiples of NAV or you hear people mention them as “high dividend” stocks let Our Man know, as it will definitely be time to get out of dodge! 

An update to the broad rationale for the thesis is below, though OM will spend less time talking about IMO 2020 and its impacts (see this piece for more on that).

Also, while the thesis holds broadly true for shipping generally, OM’s investment is in Crude Tankers and Clean Product Tankers** and so the below is focused on those.


------------------------------------------------------------------------------------------------

MASSIVE CAVEAT EMPTOR
Shipping is a terrible industry to invest in!
It is a cyclical business with high fixed costs and low operating costs that leads to ugly economics.  Where else could you lever up to buy an asset that has a 20-year life but which is only profitable for 6-8 quarters of that life cycle!  Historically, this has been compounded by largely untrustworthy management teams who have engaged in all kinds of self-dealing transactions!  Meanwhile, in shipping’s rare moments of profitability, lenders have been foolish enough to loan ship-owners more money and ship-owners have ordered yet more vessels.  This has led to an excess supply of vessels that destroys the industry’s future profitability!

So, what is OM doing and why now??
Well, the thesis is a fairly prototypical example of the type of dislocation OM likes; beaten-down stock prices, investor disinterest, attractive valuations and fundamental trends, and something that will change the narrative.

Shipping is a terrible business that’s been oversupplied for years leading to collapsing share prices, investors ignoring it and attractive valuations. This excess supply and subsequent losses led to bankruptcies/restructurings which saw lenders taking losses and equity issuance from the surviving companies and no capital to finance new vessels. Meanwhile, a major regulatory change (IMO 2020) is being enacted on January 1st, 2020 and will potentially cause further disruption to both supply and demand.

Our Man has discussed the attractiveness of optionality in investments before. In Shipping, the operational and financial leverage means that for all of the sector’s many warts, in those 6-8 quarters that a vessel is profitable you make so much $$$ that it pays for the entire vessel!  Our Man believes we are at one of those inflection points due to the combination of the companies already being around break-even, the constrained supply of new vessels, attractive pricing and trends, and the potentially disruptive impact of IMO 2020.

Background since the financial crisis
Since Great Recession, shipping has been a story of oversupply and bad rates! Whenever there were brief respites and shipping rates increased, investors lent money, ship owners ordered more ships, and rates got crushed as this new supply entered the market. Unsurprisingly, this led to falling stock prices, defaults and massive dilution for equity holders. It has also meant that many of the lenders to shipping companies (especially German banks/retail investors!!!) have exited the market.

OM’s largest position is Scorpio Tankers (STNG); this is what its stock price has done since its IPO in early 2010...
Source: Koyfin
Yup, that’s a fall from the $130 (split adjusted) IPO price to a low of $15 in late 2018!

Valuation
Unsurprisingly, after restructurings that saw debt holders suffer meaningful haircuts and further equity raises, investors have not been too keen on the shipping sector! Valuation reached an extreme in late 2018 and early 2019, when crude and product shipping companies traded for about 50-70% of their book value despite seeing stronger rates and with IMO 2020 on the horizon. Though the stocks have risen meaningfully since the start of the year, they still trade at a discount to book value. This is with rates still stronger than prior years and IMO 2020 only now starting to penetrate generalist investors’ consciousness.

Supply, Demand and Rates
As the chart below suggests, the order book for Crude tankers is near the lows of the last ~25 years and this dynamic is further improved by the increasing age of the fleet*. The story is the same for Product tankers, where the order book is the lowest (as % of the fleet) since March 2000. This discipline has largely been driven by shell-shocked management teams following the (often multiple) restructurings coupled with the limited new capital available to the sector.
Source: Clarksons, from Euronav October Presentation (Pg. 18)
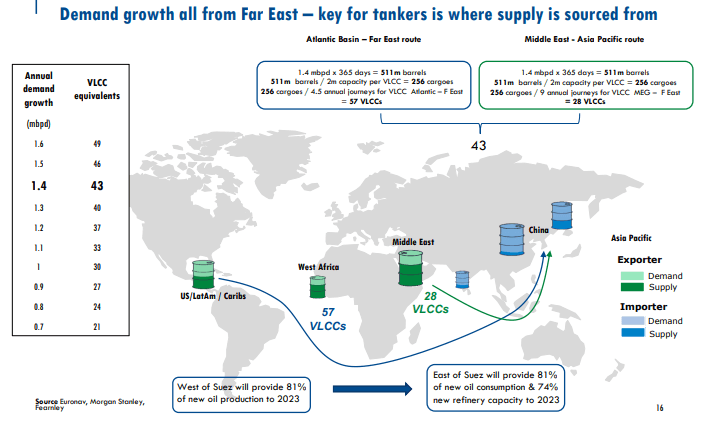
On the demand-side, oil demand has grown incrementally by a couple of percent per annum over the last 2 decades and is projected to continue its slow growth for the next few years (the IEA predicts a plateau in 2030!).  More importantly there is a major structural change in the marginal exporter of crude and petroleum products, with the US taking over this role from the Middle East. The discovery of shale oil has led to the US being responsible for up to 85% of the global increase in oil production. This has seen US exports of crude oil double since the start of 2018.  Petroleum products show a similar story and should accelerate in 2020 as new pipeline capacity to refiners comes online. 


This transition to US exports really matters to shipping companies.
Why?  Geography! 
The key for crude and product companies is where supply is sourced.  It takes about twice as long for tankers to travel from the US to Asia, compared to from the Middle East and it requires twice as many tankers. As a ship-owner, that’s a meaningful increase in demand!  With the supply of vessels fixed in the short-term, and limited new vessels on order, even small changes in demand can have major impacts on rates.  Examples of this can clearly be seen historically;
Source:  Clarksons Research Services Ltd, Clarksons Platou Securities Inc.  From Marine Money presentation (slide 7)

The impact of these changes on rates has a material impact on profitability given the operating leverage (high fixed costs, low operating costs) inherent in the business model. For an example, take the example of the crude tanker company Euronav.  The chart below, from Euronav’s October investor presentation, shows management’s guidance on the impact on EBITA (a measure of profitability) of an increase in rates. OM will spare you the math, but the middle scenario below (with VLCC rates of $40K) would lead to earnings of ~$1.40/share on a stock that’s trading at $11 today. 
Source: Euronav October 2019 presentation (slide 8)

Given the tightness of the market, and the impact on rates, could rates go much higher than $40K for VLCC's??  Take a look at that rates chart above!

Something to Change the Narrative: IMO 2020
The improvements in the supply/demand, and the valuation support, make the shipping thesis interesting but it’s the possible disruption from and investor attention caused by the IMO 2020 regulations that leads to the outsized position.   What is IMO 2020? 
  • Well, it’s a new regulatory regime that prohibits vessels from using high-sulfur fuel oil (HSFO) unless they can capture the pollution causing materials.  The allowed sulfur content is falling dramatically from 3.5% to 0.5%.
  • There is no ease-in or adjustment period.  Jan 1st, 2020 is the drop-dead date for compliance.
  • Ship operators have a limited number of choices: Use low-sulfur marine gas oil (MGO), retrofit their ships to use liquefied natural gas, slow-steam (i.e. take longer to do a route, effectively reducing supply) or install scrubbers (to capture the pollution causing materials).
  • Scrubbers are a popular choice but are expensive ($1-10mn/ship) and vessels have to be dry-docked, and removed from service, for them to be fitted.   This temporarily reduces supply.
  • Given the costs of the various options for IMO 2020 compliance a number of older ships are expected to be retired, reducing the supply of vessels.
For crude and product tankers, in addition to the likely supply side impacts above, OM thinks that there will also be positive demand-side impacts!  There’s now a price on sulfur content in oil and this will likely cause changes in refinery demand, and oil trade routes.  If you want to read more on OM’s IMO 2020 thoughts, you can right here!


Some Risks To the Thesis:
A far from extensive list includes:
  • It’s shipping!  Did you not read the caveat emptor – it’s a terrible, horrible, no good, very bad industry.
  • A global slowdown could impact oil demand, meaning headwinds for both the companies and the stocks.
  • IMO 2020’s impact could be more akin to Y2K, meaning that rates wander around current levels.
  • Common perception is that an escalation in the 'trade war' between the US and China would be bad.  Our Man is a little more sanguine on that as trade wars mean the disrupting of old trade routes, and the creation of new and less efficient ones.

-------------------------------------------------------------------------------------------------------

* Vessels over 15yrs old have to be surveyed more frequently (2.5yrs vs. 5yrs) and the cost of this increases with the age of the vessel (~$4mn for a 20yr old ship vs. ~$2mn for a 10yr old vessel)

** Crude Tankers transport unrefined crude oil to refineries, and Product Tankers move the refined oil products (e.g. light petroleum products) to points near consuming markets.


Disclaimer:  As noted above Our Man holds positions in crude and product tanker companies, specifically he has positions in Scorpio Tankers (STNG), Euronav (EUR) and Diamond S Shipping (DSSI).